
Exhibit 99.1
BRIDGE INVESTMENT GROUP HOLDINGS INC. REPORTS FIRST QUARTER 2022 RESULTS
SALT LAKE CITY, UTAH—May 9, 2022—Bridge Investment Group Holdings Inc. (NYSE: BRDG) (“Bridge” or the “Company”) today reported its financial results for the first quarter ended March 31, 2022.
Total Revenue and Investment Income were $104.1 million and $74.8 million, respectively, for the quarter ended March 31, 2022. These increased 78% and 253%, respectively, from revenue and investment income figures of $58.5 million and $21.2 million, respectively, for the quarter ended March 31, 2021.
Net Income applicable to Bridge Investment Group Holdings LLC (the “Operating Company”) was $97.5 million for the quarter ended March 31, 2022, compared to $40.7 million for the quarter ended March 31, 2021, representing a 140% increase year-over-year. On a basic and diluted basis, net income attributable to Bridge per share of Class A common stock was $0.35.
Distributable Earnings of the Operating Company were $47.9 million, or $0.28 per share after-tax, for the quarter ended March 31, 2022, compared to $16.9 million, or $0.12 per share after-tax, for the quarter ended March 31, 2021 on a proforma basis, representing a 133% increase year-over-year on a per share basis.
Robert Morse, Bridge’s Executive Chairman, remarked, “Bridge delivered the best first quarter in company history despite a more volatile macroeconomic environment. Our Company continues to benefit from increasing allocation to alternative investments in commercial real estate, robust capital raising activities, and our specialized focus on some of the most attractive investment sectors within US real estate. We believe Bridge’s strategic focus on residential, logistics and yield-oriented investments positions us well for continued success.”
Jonathan Slager, Bridge’s Chief Executive Officer, added “Commercial real estate fundamentals in our specialized segments continue to be strong. Our focus on the value-add sector of target markets and forward integration into property management position Bridge to succeed. We had an active quarter, deploying more than $638.6 million and increasing fee-earning AUM to $14.7 billion, up 43% compared to a year ago. Additionally, strong investment performance year-to-date and another successful fundraising quarter for Bridge totaling $1.1 billion represent a solid beginning for 2022.”
Common Dividend
Bridge declared a quarterly dividend of $0.26 per share of its Class A common stock, payable on June 17, 2022 to its Class A common stockholders of record at the close of business on June 3, 2022.
Additional Information
Bridge Investment Group Holdings Inc. issued a full detailed presentation of its first quarter 2022 results, which can be viewed on the Investors section of our website at www.bridgeig.com. The presentation is titled “First Quarter 2022 Earnings Presentation.”
Conference Call and Webcast Information
The Company will host a conference call on May 10, 2022 at 8:30 a.m. ET to discuss its first quarter results. Interested parties may access the conference call live over the phone by dialing 1-877-405-1210 (Toll Free) or 1-201-689-8721 (Toll/International) and requesting Bridge Investment Group Holdings Inc.’s First Quarter 2022 Earnings Conference Call. Participants are asked to dial in a few minutes prior to the call to register for the event. The event will also be available live via webcast which can be accessed here or from our Investor Relations website https://ir.bridgeig.com.
An audio replay of the conference call will be available approximately three hours after the conference call until 11:59 p.m. ET on May 24, 2022 and can be accessed by dialing 1-877-660-6853 (Toll Free) or 1-201-612-7415 (Toll/International), and providing the passcode 13728883.
About Bridge Investment Group Holdings Inc.
Bridge is a leading, vertically integrated real estate investment manager, diversified across specialized asset classes, with approximately $38.8 billion of assets under management as of March 31, 2022. Bridge combines its nationwide operating platform with dedicated teams of investment professionals focused on select U.S. real estate verticals: residential rental, office, development, logistics properties, net lease and real estate-backed credit.
Forward-Looking Statements
This earnings release contains certain “forward-looking statements” within the meaning of the Private Securities Litigation Reform Act of 1995, which relate to future events or our future performance or financial condition. All statements other than statements of historical facts may be forward-looking statements. In some cases, you can identify forward-looking statements by terms such as “outlook,” “could,” “believes,” “expects,” “potential,” “opportunity,” “continues,” “may,” “will,” “should,” “over time,” “seeks,” “predicts,” “intends,” “plans,” “estimates,” “anticipates,” “foresees” or negative versions of those words, other comparable words or other statements that do not relate to historical or factual matters. Accordingly, we caution you that any such forward-looking statements are based on our beliefs, assumptions and expectations as of the date made of our future performance, taking into account all information available to us at that time. These statements are not guarantees of future performance, conditions or results and involve a number of risks and uncertainties that are difficult to predict and beyond our control. Actual results may differ materially from those express or implied in the forward-looking statements as a result of a number of factors, including but not limited to those risks described from time to time in our filings with the Securities and Exchange Commission. Any forward-looking statement speaks only as of the date on which it is made. Bridge Investment Group Holdings Inc. undertakes no duty to publicly update any forward-looking statements made herein or on the webcast/conference call, whether as a result of new information, future developments or otherwise, except as required by law.
Nothing in this press release constitutes an offer to sell or solicitation of an offer to buy any securities of the Company or any investment fund managed by the Company or its affiliates.
Shareholder Relations Contact:
Bonni Rosen
Bridge Investment Group Holdings Inc.
shareholderrelations@bridgeig.com
Media:
Charlotte Morse
Bridge Investment Group Holdings Inc.
(877) 866-4540
st 1 Quarter 2022 Earnings Presentation May 10, 2022

DISCLAIMER The information contained herein does not constitute or form part of, and should not be construed as, an offer or invitation to subscribe for, underwrite or otherwise acquire, any securities of Bridge Investment Group Holdings Inc. (“Bridge” or the “Company”) or any affiliate of Bridge, or any fund or other investment vehicle managed by Bridge or an affiliate of Bridge. This presentation should not form the basis of, or be relied on in connection with, any contract to purchase or subscribe for any securities of Bridge or any fund or other investment vehicle managed by Bridge or an affiliate of Bridge, or in connection with any other contract or commitment whatsoever. This presentation does not constitute a “prospectus” within the meaning of the Securities Act of 1933, as amended. Any decision to purchase securities of Bridge or any of its affiliates should be made solely on the basis of the information contained in a prospectus to be issued by Bridge in relation to a specific offering. Forward‐Looking Statements This presentation contains forward‐looking statements. All statements other than statements of historical facts contained in this presentation may be forward‐looking statements. Statements regarding our future results of operations and financial position, business strategy and plans and objectives of management for future operations, including, among others, statements regarding expected growth, capital raising, expectations or targets related to financial and non‐financial measures, future capital expenditures, fund performance and debt service obligations, are forward‐looking statements. In some cases, you can identify forward‐looking statements by terms, such as “may,” “will,” “should,” “expects,” “plans,” “seek,” “anticipates,” “plan,” “forecasts,” “outlook,” “could,” “intends,” “targets,” “projects,” “contemplates,” “believes,” “estimates,” “predicts,” “potential” or “continue” or the negative of these terms or other similar expressions. Accordingly, we caution you that any such forward‐looking statements are not guarantees of future performance and are subject to risks, assumptions and uncertainties that are difficult to predict and beyond our ability to control. Although we believe that the expectations reflected in these forward‐looking statements are reasonable as of the date made, actual results may prove to be materially different from the results expressed or implied by the forward‐looking statements. If one or more events related to these forward‐looking statements or other risks or uncertainties materialize, or if our underlying assumptions prove to be incorrect, actual results may differ materially from what we anticipate. Many of the important factors that will determine these results are beyond our ability to control or predict. We believe these factors include but are not limited to those risk factors described under the section entitled “Risk Factors” in our Annual Report on Form 10‐K for the year ended December 31, 2021, filed with the United States Securities and Exchange Commission (the “SEC”) on March 18, 2022, which will be updated upon filing our Quarterly Report on Form 10‐Q for the three months ended March 31, 2022, accessible on the SEC’s website at www.sec.gov. These factors should not be construed as exhaustive and should be read in conjunction with other cautionary statements included in this report and our other filings. You should not place undue reliance on any such forward‐looking statements. Any forward‐looking statement speaks only as of the date on which it is made, and, except as otherwise required by law, we do not undertake any obligation to publicly update or review any forward‐looking statement, whether as a result of new information, future developments or otherwise. New factors emerge from time to time, and it is not possible for us to predict which will arise. We cannot assess the impact of each factor on our business or the extent to which any factor, or combination of factors, may cause actual results to differ materially from those contained in any forward‐looking statements. Industry Information Unless otherwise indicated, information contained in this presentation concerning our industry, competitive position and the markets in which we operate is based on information from independent industry and research organizations, other third‐party sources and management estimates. Management estimates are derived from publicly available information released by independent industry analysts and other third‐party sources, as well as data from our internal research, and are based on assumptions made by us upon reviewing such data, and our experience in, and knowledge of, such industry and markets, which we believe to be reasonable. In addition, projections, assumptions and estimates of the future performance of the industry in which we operate and our future performance are necessarily subject to uncertainty and risk due to a variety of factors, which could cause results to differ materially from those expressed in the estimates made by the independent parties and by us. Non‐GAAP Financial Measures This presentation uses financial measures that are not presented in accordance with generally accepted accounted principles in the United States (“GAAP”), such as Distributable Earnings, Fee Related Earnings, Fee Related Revenues and Performance Related Earnings, to supplement financial information presented in accordance with GAAP. There are limitations to the use of the non‐GAAP financial measures presented in this presentation. For example, the non‐GAAP financial measures may not be comparable to similarly titled measures of other companies. Other companies may calculate non‐GAAP financial measures differently than the Company, limiting the usefulness of those measures for comparative purposes. 2
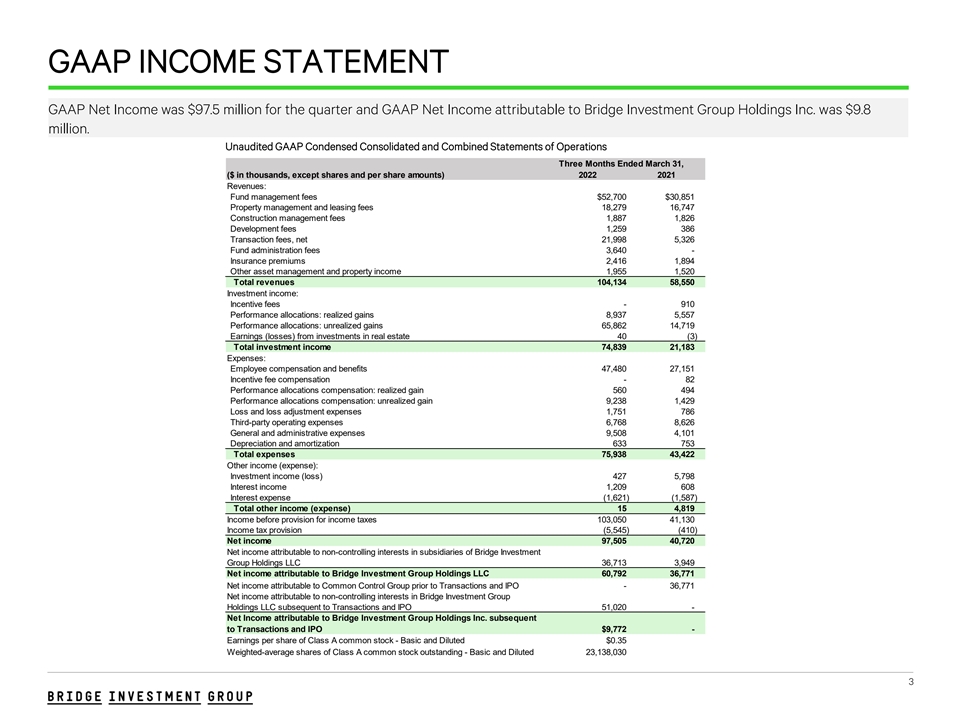
GAAP INCOME STATEMENT GAAP Net Income was $97.5 million for the quarter and GAAP Net Income attributable to Bridge Investment Group Holdings Inc. was $9.8 million. Unaudited GAAP Condensed Consolidated and Combined Statements of Operations Three Months Ended March 31, ($ in thousands, except shares and per share amounts) 2022 2021 Revenues: Fund management fees $52,700 $30,851 Property management and leasing fees 18,279 16,747 Construction management fees 1,887 1,826 Development fees 1,259 386 Transaction fees, net 21,998 5,326 Fund administration fees 3,640 - Insurance premiums 2,416 1,894 Other asset management and property income 1,955 1,520 Total revenues 104,134 58,550 Investment income: Incentive fees - 910 Performance allocations: realized gains 8,937 5,557 Performance allocations: unrealized gains 65,862 14,719 Earnings (losses) from investments in real estate 40 (3) Total investment income 74,839 21,183 Expenses: Employee compensation and benefits 47,480 27,151 Incentive fee compensation - 82 Performance allocations compensation: realized gain 560 494 Performance allocations compensation: unrealized gain 9,238 1,429 Loss and loss adjustment expenses 1,751 786 Third-party operating expenses 6,768 8,626 General and administrative expenses 9,508 4,101 Depreciation and amortization 633 753 Total expenses 75,938 43,422 Other income (expense): Investment income (loss) 427 5,798 Interest income 1,209 608 Interest expense (1,621) (1,587) Total other income (expense) 15 4,819 Income before provision for income taxes 103,050 41,130 Income tax provision (5,545) (410) Net income 97,505 40,720 Net income attributable to non-controlling interests in subsidiaries of Bridge Investment Group Holdings LLC 36,713 3,949 Net income attributable to Bridge Investment Group Holdings LLC 60,792 36,771 Net income attributable to Common Control Group prior to Transactions and IPO - 36,771 Net income attributable to non-controlling interests in Bridge Investment Group Holdings LLC subsequent to Transactions and IPO 51,020 - Net Income attributable to Bridge Investment Group Holdings Inc. subsequent to Transactions and IPO $9,772 - Earnings per share of Class A common stock - Basic and Diluted $0.35 Weighted-average shares of Class A common stock outstanding - Basic and Diluted 23,138,030 3
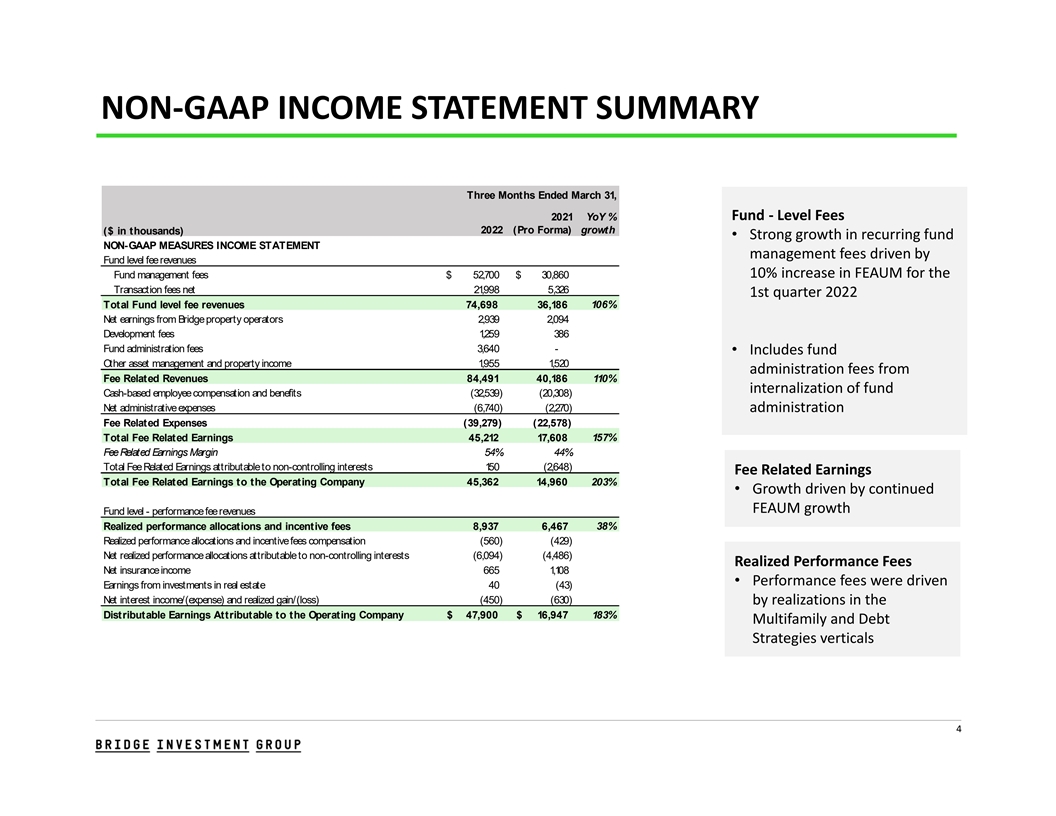
NON‐GAAP INCOME STATEMENT SUMMARY Three Months Ended March 31, Fund ‐ Level Fees 2021 YoY % 2022 (Pro Forma) growth ($ in thousands) • Strong growth in recurring fund NON-GAAP MEASURES INCOME STATEMENT management fees driven by Fund level fee revenues 10% increase in FEAUM for the Fund management fees $ 52,700 $ 30,860 Transa ction fees net 21 ,998 5,326 1st quarter 2022 Total Fund level fee revenues 74,698 36,186 106% Net earnings from Bridge property operators 2,939 2,094 Development fe es 1 ,259 386 Fund administration fees 3,640 - • Includes fund Other asset management and property income 1 ,955 1,520 administration fees from Fee Related Revenues 84,491 40,186 110% internalization of fund Cash-based employee compensation and benefits (32,539) (20,308) Net administrative expenses (6,740) (2,270) administration Fee Related Expenses (39,279) (22,578) Total Fee Related Earnings 45,212 17,608 157% Fee Related Earnings Margin 54% 44% Total Fee Related Earnings attributable to non-controlling interests 1 50 (2,648) Fee Related Earnings Total Fee Related Earnings to the Operating Company 45,362 14,960 203% • Growth driven by continued FEAUM growth Fund level - performance fee revenues Realized performance allocations and incentive fees 8,937 6,467 38% Realized performance a llocations a nd incentive fee s compensa tion (560) (429) Net realized performance allocations attributable to non-controlling interests (6,094) (4,486) Realized Performance Fees Net insurance income 665 1,108 • Performance fees were driven Earnings from investments in real estate 40 (43) Net interest income/(expense) and realized gain/(loss) (450) (630) by realizations in the Distributable Earnings Attributable to the Operating Company $ 47,900 $ 16,947 183% Multifamily and Debt Strategies verticals 4
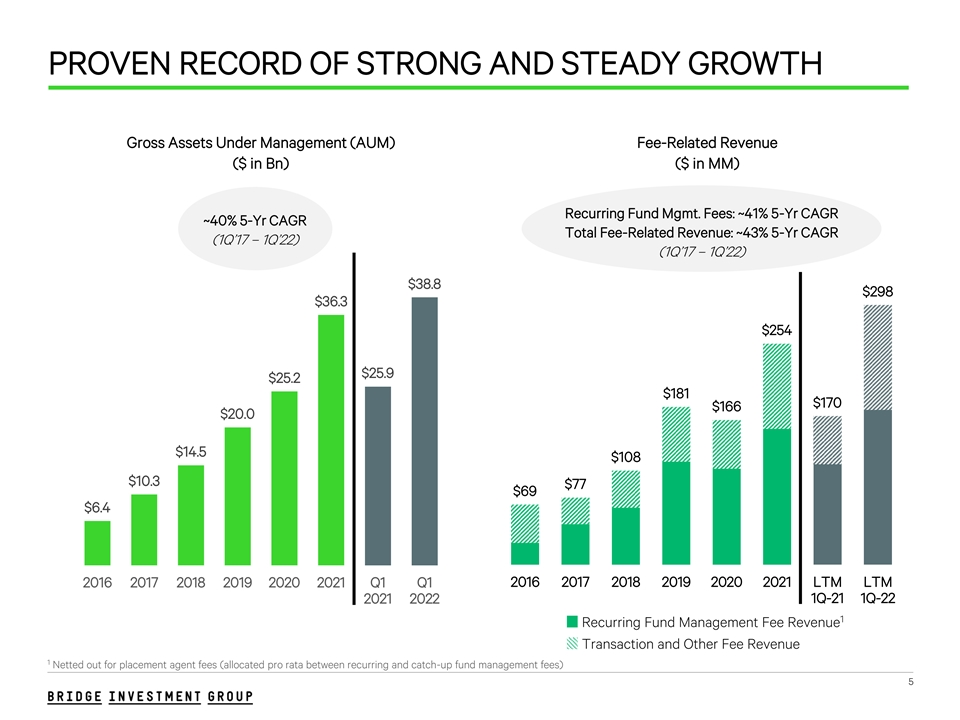
PROVEN RECORD OF STRONG AND STEADY GROWTH Gross Assets Under Management (AUM) Fee-Related Revenue ($ in Bn) ($ in MM) Recurring Fund Mgmt. Fees: ~41% 5-Yr CAGR ~40% 5-Yr CAGR Total Fee-Related Revenue: ~43% 5-Yr CAGR (1Q’17 – 1Q’22) (1Q’17 – 1Q’22) $38.8 $298 $36.3 $254 $25.9 $25.2 $181 $170 $166 $20.0 $14.5 $108 $10.3 $77 $69 $6.4 2016 2017 2018 2019 2020 2021 LTM LTM 2016 2017 2018 2019 2020 2021 Q1 Q1 1Q-21 1Q-22 2021 2022 1 Recurring Fund Management Fee Revenue Transaction and Other Fee Revenue 1 Netted out for placement agent fees (allocated pro rata between recurring and catch-up fund management fees) 5
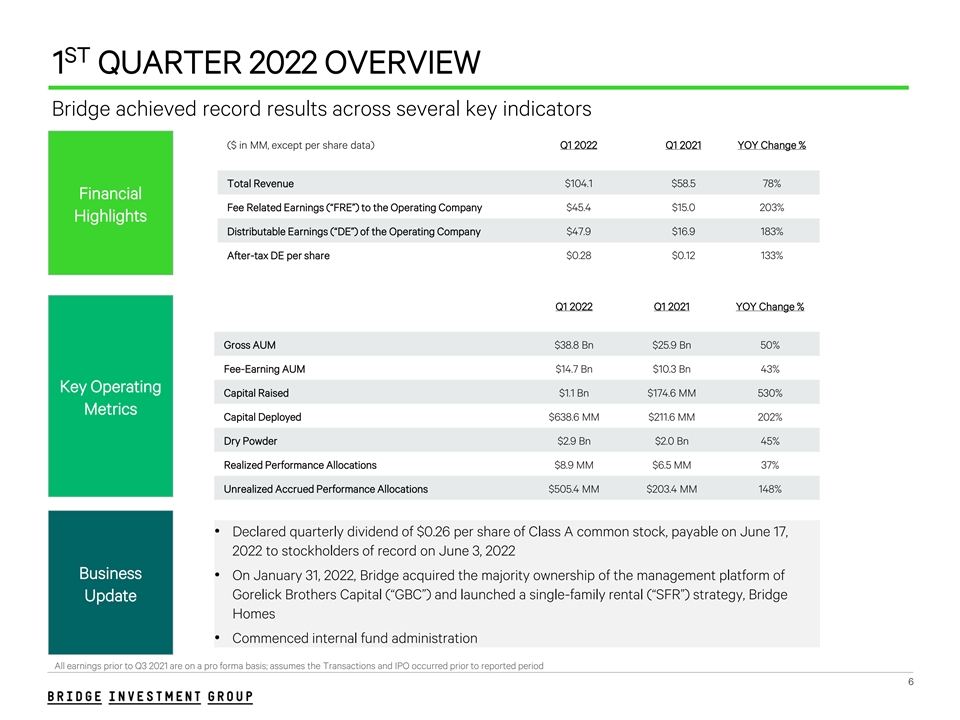
ST 1 QUARTER 2022 OVERVIEW Bridge achieved record results across several key indicators ($ in MM, except per share data) Q1 2022 Q1 2021 YOY Change % Total Revenue $104.1 $58.5 78% Financial Fee Related Earnings (“FRE”) to the Operating Company $45.4 $15.0 203% Highlights Distributable Earnings (“DE”) of the Operating Company $47.9 $16.9 183% After-tax DE per share $0.28 $0.12 133% Q1 2022 Q1 2021 YOY Change % Gross AUM $38.8 Bn $25.9 Bn 50% Fee-Earning AUM $14.7 Bn $10.3 Bn 43% Key Operating Capital Raised $1.1 Bn $174.6 MM 530% Metrics Capital Deployed $638.6 MM $211.6 MM 202% Dry Powder $2.9 Bn $2.0 Bn 45% Realized Performance Allocations $8.9 MM $6.5 MM 37% Unrealized Accrued Performance Allocations $505.4 MM $203.4 MM 148% • Declared quarterly dividend of $0.26 per share of Class A common stock, payable on June 17, 2022 to stockholders of record on June 3, 2022 Business • On January 31, 2022, Bridge acquired the majority ownership of the management platform of Gorelick Brothers Capital (“GBC”) and launched a single-family rental (“SFR”) strategy, Bridge Update Homes • Commenced internal fund administration All earnings prior to Q3 2021 are on a pro forma basis; assumes the Transactions and IPO occurred prior to reported period 6

ST 1 QUARTER FINANCIAL RESULTS
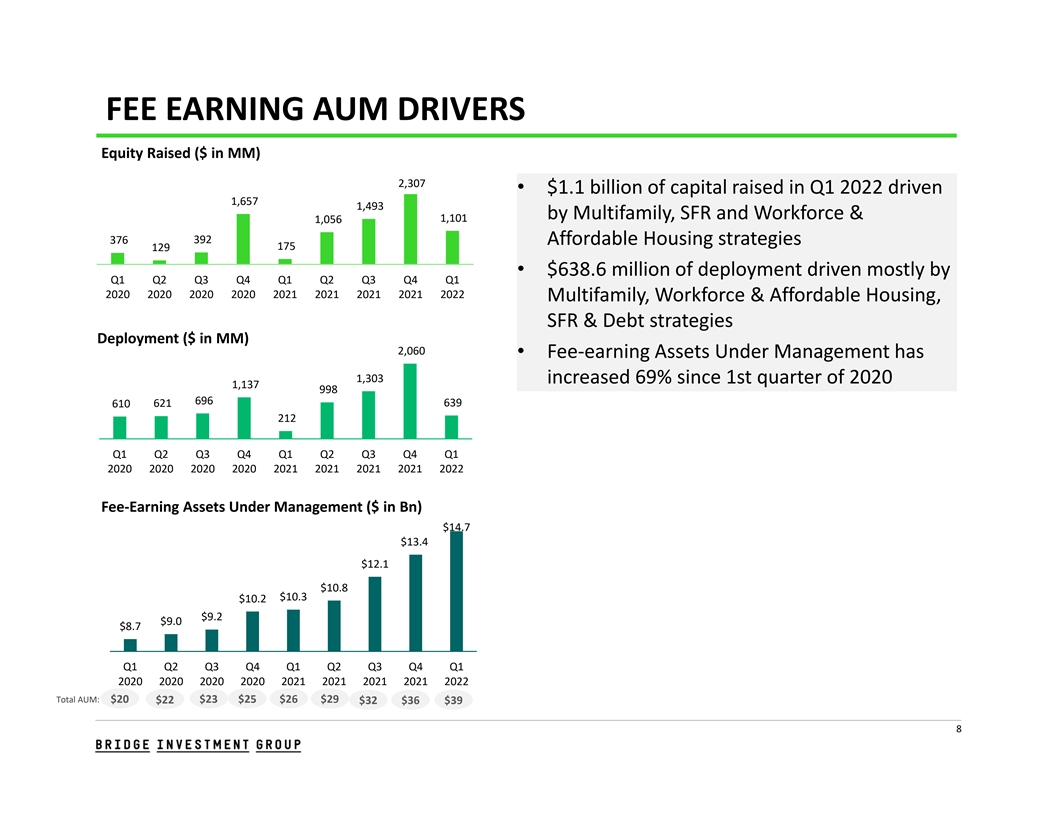
FEE EARNING AUM DRIVERS Equity Raised ($ in MM) 2,307 • $1.1 billion of capital raised in Q1 2022 driven 1,657 1,493 by Multifamily, SFR and Workforce & 1,101 1,056 376 392 Affordable Housing strategies 175 129 • $638.6 million of deployment driven mostly by Q1 Q2 Q3 Q4 Q1 Q2 Q3 Q4 Q1 2020 2020 2020 2020 2021 2021 2021 2021 2022 Multifamily, Workforce & Affordable Housing, SFR & Debt strategies Deployment ($ in MM) 2,060 • Fee‐earning Assets Under Management has 1,303 increased 69% since 1st quarter of 2020 1,137 998 696 621 639 610 212 Q1 Q2 Q3 Q4 Q1 Q2 Q3 Q4 Q1 2020 2020 2020 2020 2021 2021 2021 2021 2022 Fee‐Earning Assets Under Management ($ in Bn) $14.7 $13.4 $12.1 $10.8 $10.3 $10.2 $9.2 $9.0 $8.7 Q1 Q2 Q3 Q4 Q1 Q2 Q3 Q4 Q1 2020 2020 2020 2020 2021 2021 2021 2021 2022 Total AUM: $20 $23 $25 $26 $29 $22 $32 $36 $39 8
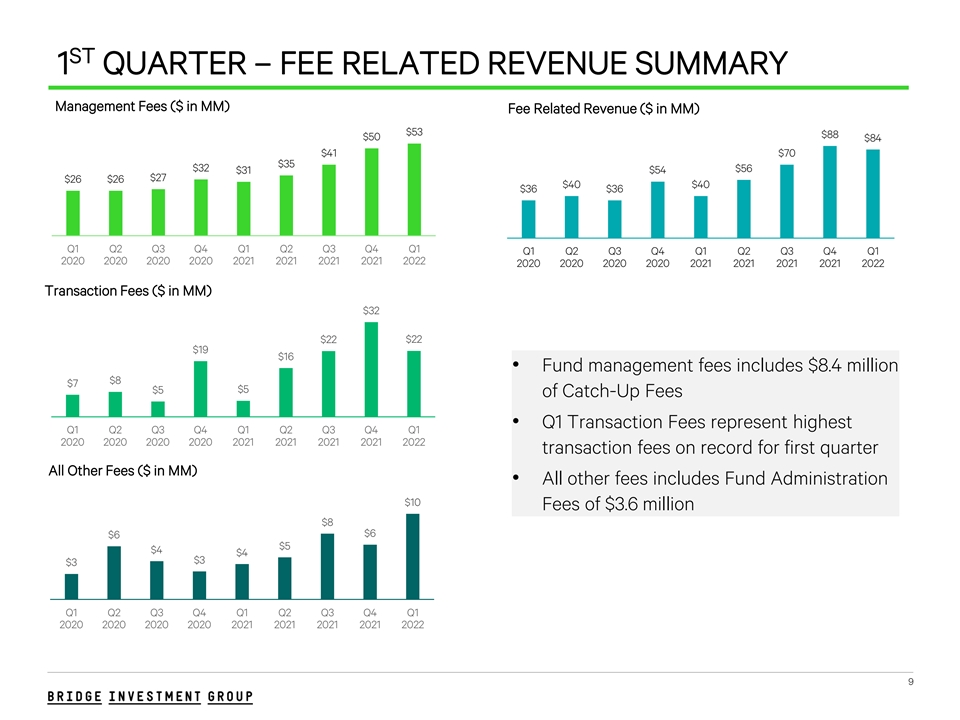
ST 1 QUARTER – FEE RELATED REVENUE SUMMARY Management Fees ($ in MM) Fee Related Revenue ($ in MM) $53 $88 $50 $84 $41 $70 $35 $32 $56 $54 $31 $27 $26 $26 $40 $40 $36 $36 Q1 Q2 Q3 Q4 Q1 Q2 Q3 Q4 Q1 Q1 Q2 Q3 Q4 Q1 Q2 Q3 Q4 Q1 2020 2020 2020 2020 2021 2021 2021 2021 2022 2020 2020 2020 2020 2021 2021 2021 2021 2022 Transaction Fees ($ in MM) $32 $22 $22 $19 $16 • Fund management fees includes $8.4 million $8 $7 $5 $5 of Catch-Up Fees • Q1 Transaction Fees represent highest Q1 Q2 Q3 Q4 Q1 Q2 Q3 Q4 Q1 2020 2020 2020 2020 2021 2021 2021 2021 2022 transaction fees on record for first quarter All Other Fees ($ in MM) • All other fees includes Fund Administration $10 Fees of $3.6 million $8 $6 $6 $5 $4 $4 $3 $3 Q1 Q2 Q3 Q4 Q1 Q2 Q3 Q4 Q1 2020 2020 2020 2020 2021 2021 2021 2021 2022 9
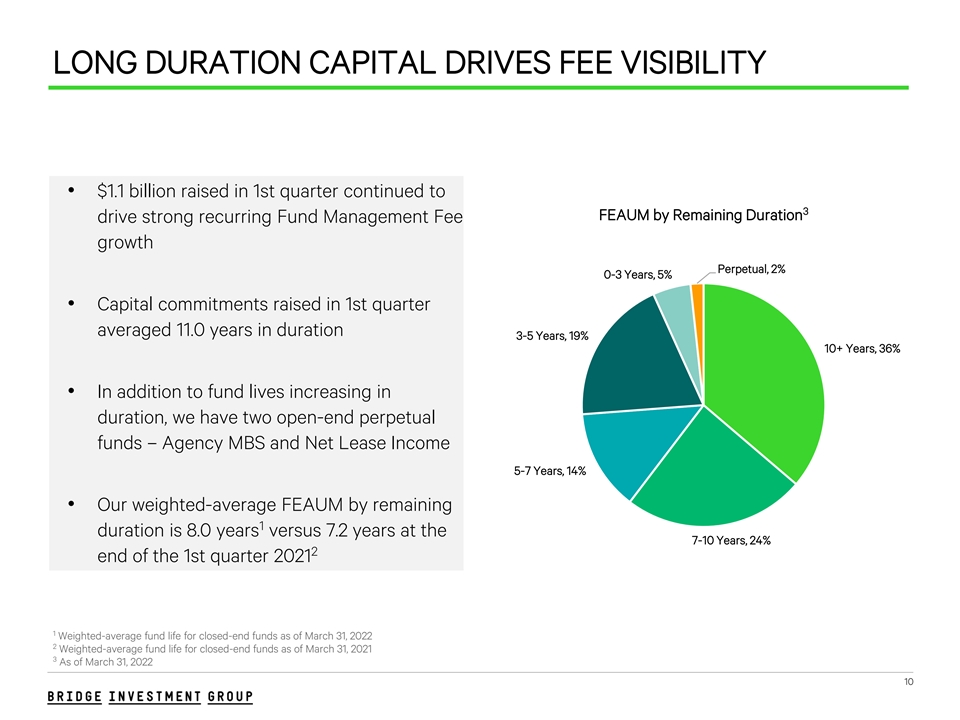
LONG DURATION CAPITAL DRIVES FEE VISIBILITY • $1.1 billion raised in 1st quarter continued to 3 FEAUM by Remaining Duration drive strong recurring Fund Management Fee growth Perpetual, 2% 0-3 Years, 5% • Capital commitments raised in 1st quarter averaged 11.0 years in duration 3-5 Years, 19% 10+ Years, 36% • In addition to fund lives increasing in duration, we have two open-end perpetual funds – Agency MBS and Net Lease Income 5-7 Years, 14% • Our weighted-average FEAUM by remaining 1 duration is 8.0 years versus 7.2 years at the 7-10 Years, 24% 2 end of the 1st quarter 2021 1 Weighted-average fund life for closed-end funds as of March 31, 2022 2 Weighted-average fund life for closed-end funds as of March 31, 2021 3 As of March 31, 2022 10
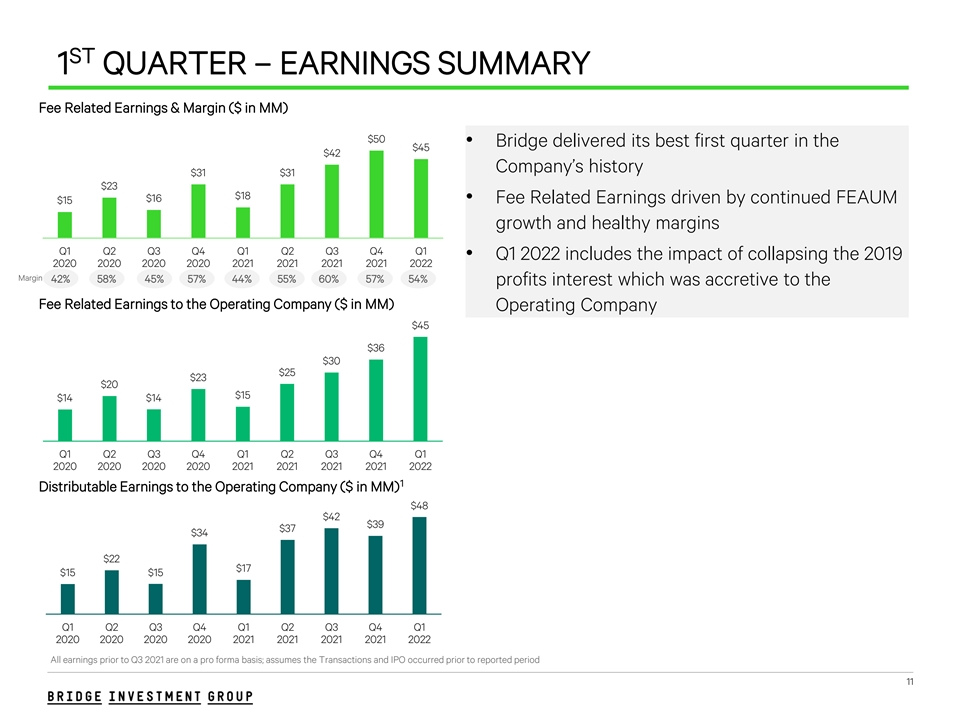
ST 1 QUARTER – EARNINGS SUMMARY Fee Related Earnings & Margin ($ in MM) $50 • Bridge delivered its best first quarter in the $45 $42 Company’s history $31 $31 $23 $18 $16 $15 • Fee Related Earnings driven by continued FEAUM growth and healthy margins Q1 Q2 Q3 Q4 Q1 Q2 Q3 Q4 Q1 • Q1 2022 includes the impact of collapsing the 2019 2020 2020 2020 2020 2021 2021 2021 2021 2022 Margin 42% 58% 45% 57% 44% 55% 60% 57% 54% profits interest which was accretive to the Fee Related Earnings to the Operating Company ($ in MM) Operating Company $45 $36 $30 $25 $23 $20 $15 $14 $14 Q1 Q2 Q3 Q4 Q1 Q2 Q3 Q4 Q1 2020 2020 2020 2020 2021 2021 2021 2021 2022 1 Distributable Earnings to the Operating Company ($ in MM) $48 $42 $39 $37 $34 $22 $17 $15 $15 Q1 Q2 Q3 Q4 Q1 Q2 Q3 Q4 Q1 2020 2020 2020 2020 2021 2021 2021 2021 2022 All earnings prior to Q3 2021 are on a pro forma basis; assumes the Transactions and IPO occurred prior to reported period 11
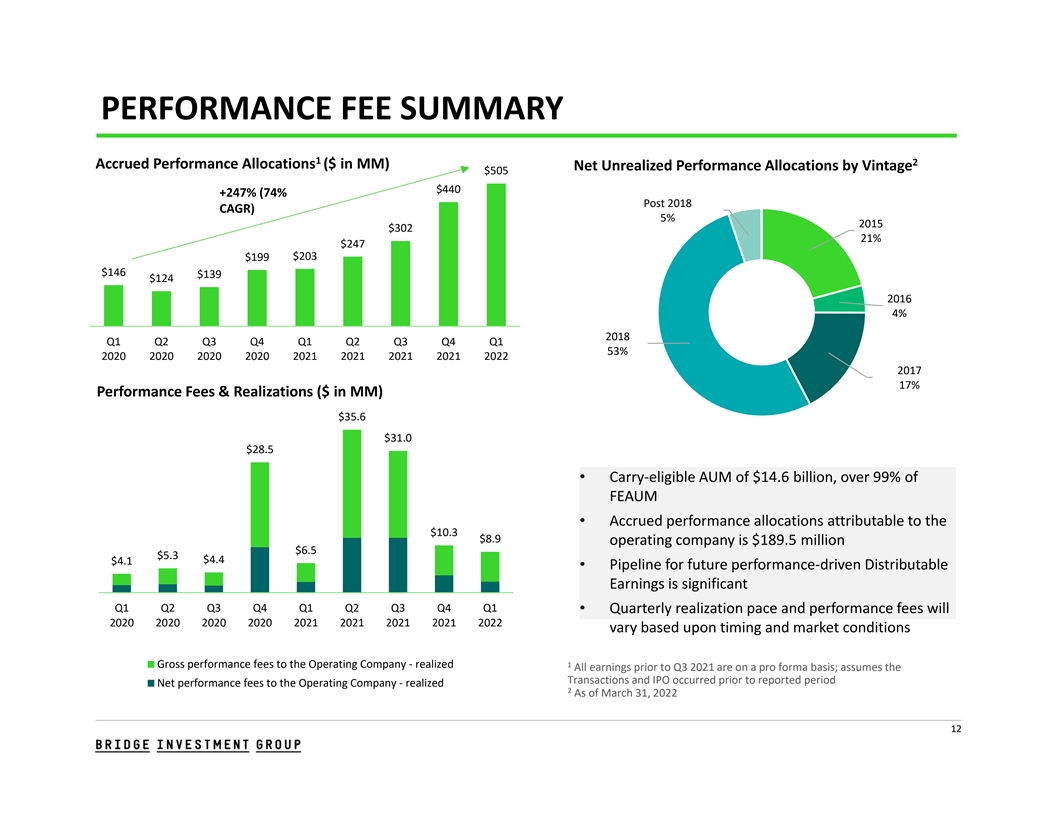
PERFORMANCE FEE SUMMARY 1 2 Accrued Performance Allocations ($ in MM) Net Unrealized Performance Allocations by Vintage $505 $440 +247% (74% Post 2018 CAGR) 5% 2015 $302 21% $247 $203 $199 $146 $139 $124 2016 4% 2018 Q1 Q2 Q3 Q4 Q1 Q2 Q3 Q4 Q1 53% 2020 2020 2020 2020 2021 2021 2021 2021 2022 2017 17% Performance Fees & Realizations ($ in MM) $35.6 $31.0 $28.5 • Carry‐eligible AUM of $14.6 billion, over 99% of FEAUM • Accrued performance allocations attributable to the $10.3 $8.9 operating company is $189.5 million $6.5 $5.3 $4.4 $4.1 • Pipeline for future performance‐driven Distributable Earnings is significant Q1 Q2 Q3 Q4 Q1 Q2 Q3 Q4 Q1 • Quarterly realization pace and performance fees will 2020 2020 2020 2020 2021 2021 2021 2021 2022 vary based upon timing and market conditions Gross performance fees to the Operating Company ‐ realized 1 All earnings prior to Q3 2021 are on a pro forma basis; assumes the Transactions and IPO occurred prior to reported period Net performance fees to the Operating Company ‐ realized 2 As of March 31, 2022 12
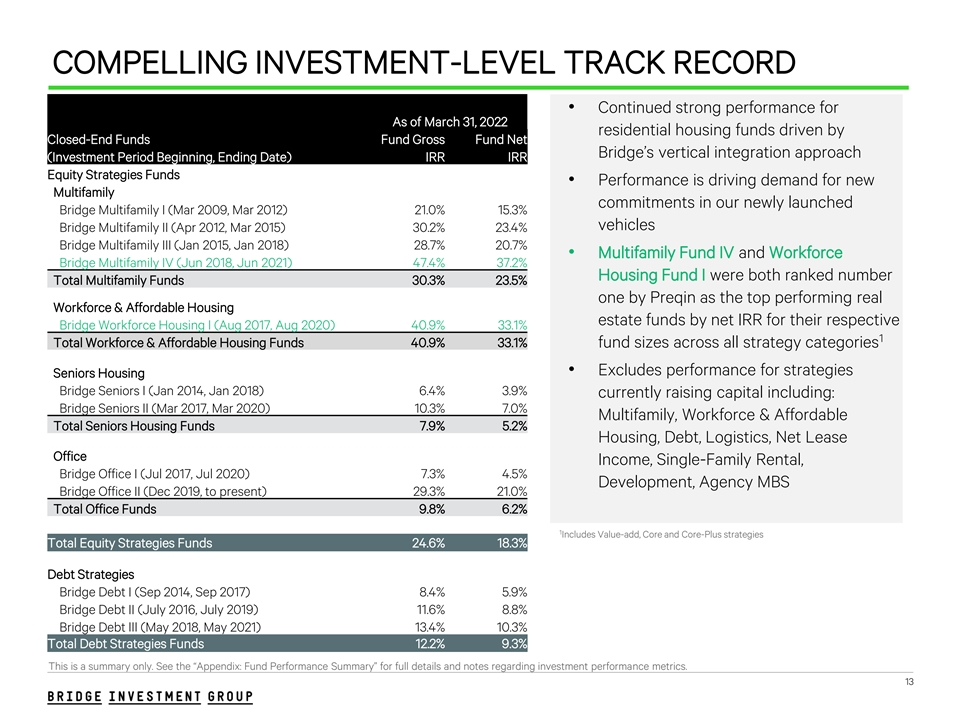
COMPELLING INVESTMENT-LEVEL TRACK RECORD • Continued strong performance for As of March 31, 2022 residential housing funds driven by Closed-End Funds Fund Gross Fund Net Bridge’s vertical integration approach (Investment Period Beginning, Ending Date) IRR IRR Equity Strategies Funds • Performance is driving demand for new Multifamily commitments in our newly launched Bridge Multifamily I (Mar 2009, Mar 2012) 21.0% 15.3% vehicles Bridge Multifamily II (Apr 2012, Mar 2015) 30.2% 23.4% Bridge Multifamily III (Jan 2015, Jan 2018) 28.7% 20.7% • Multifamily Fund IV and Workforce Bridge Multifamily IV (Jun 2018, Jun 2021) 47.4% 37.2% Housing Fund I were both ranked number Total Multifamily Funds 30.3% 23.5% one by Preqin as the top performing real Workforce & Affordable Housing estate funds by net IRR for their respective Bridge Workforce Housing I (Aug 2017, Aug 2020) 40.9% 33.1% 1 Total Workforce & Affordable Housing Funds 40.9% 33.1% fund sizes across all strategy categories • Excludes performance for strategies Seniors Housing Bridge Seniors I (Jan 2014, Jan 2018) 6.4% 3.9% currently raising capital including: Bridge Seniors II (Mar 2017, Mar 2020) 10.3% 7.0% Multifamily, Workforce & Affordable Total Seniors Housing Funds 7.9% 5.2% Housing, Debt, Logistics, Net Lease Office Income, Single-Family Rental, Bridge Office I (Jul 2017, Jul 2020) 7.3% 4.5% Development, Agency MBS Bridge Office II (Dec 2019, to present) 29.3% 21.0% Total Office Funds 9.8% 6.2% 1 Includes Value-add, Core and Core-Plus strategies Total Equity Strategies Funds 24.6% 18.3% Debt Strategies Bridge Debt I (Sep 2014, Sep 2017) 8.4% 5.9% Bridge Debt II (July 2016, July 2019) 11.6% 8.8% Bridge Debt III (May 2018, May 2021) 13.4% 10.3% Total Debt Strategies Funds 12.2% 9.3% This is a summary only. See the “Appendix: Fund Performance Summary” for full details and notes regarding investment performance metrics. 13
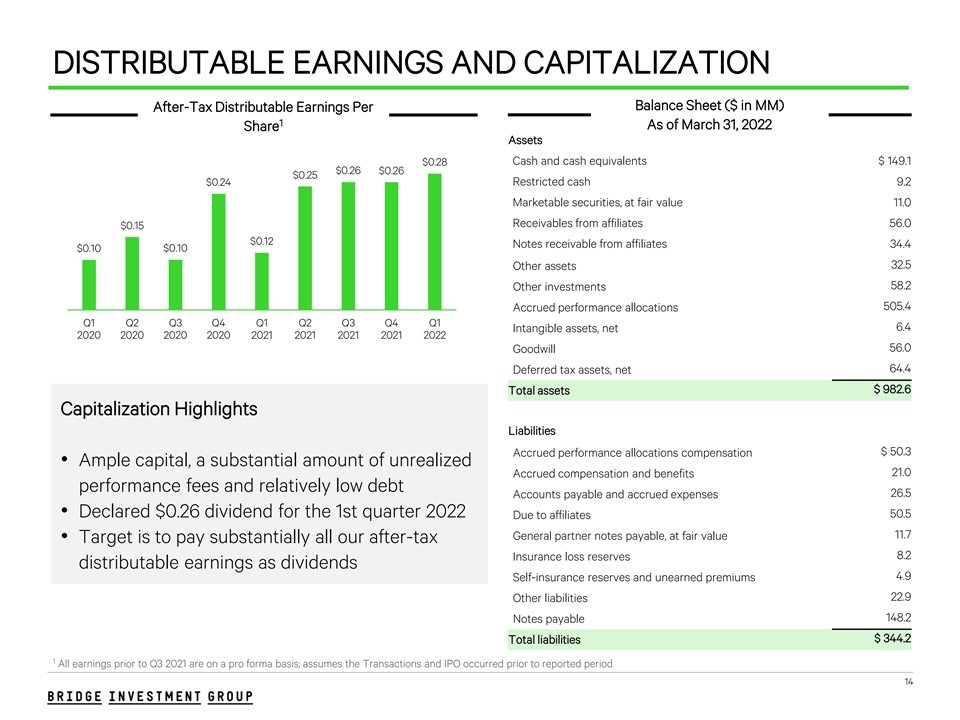
DISTRIBUTABLE EARNINGS AND CAPITALIZATION Balance Sheet ($ in MM) After-Tax Distributable Earnings Per 1 As of March 31, 2022 Share Assets $0.28 Cash and cash equivalents $ 149.1 $0.26 $0.26 $0.25 Restricted cash 9.2 $0.24 Marketable securities, at fair value 11.0 Receivables from affiliates 56.0 $0.15 $0.12 Notes receivable from affiliates 34.4 $0.10 $0.10 32.5 Other assets 58.2 Other investments 505.4 Accrued performance allocations Q1 Q2 Q3 Q4 Q1 Q2 Q3 Q4 Q1 6.4 Intangible assets, net 2020 2020 2020 2020 2021 2021 2021 2021 2022 56.0 Goodwill 64.4 Deferred tax assets, net $ 982.6 Total assets Capitalization Highlights Liabilities $ 50.3 Accrued performance allocations compensation • Ample capital, a substantial amount of unrealized 21.0 Accrued compensation and benefits performance fees and relatively low debt 26.5 Accounts payable and accrued expenses • Declared $0.26 dividend for the 1st quarter 2022 50.5 Due to affiliates 11.7 General partner notes payable, at fair value • Target is to pay substantially all our after-tax 8.2 Insurance loss reserves distributable earnings as dividends 4.9 Self-insurance reserves and unearned premiums 22.9 Other liabilities 148.2 Notes payable $ 344.2 Total liabilities 1 All earnings prior to Q3 2021 are on a pro forma basis; assumes the Transactions and IPO occurred prior to reported period 14

INTRODUCTION TO BRIDGE
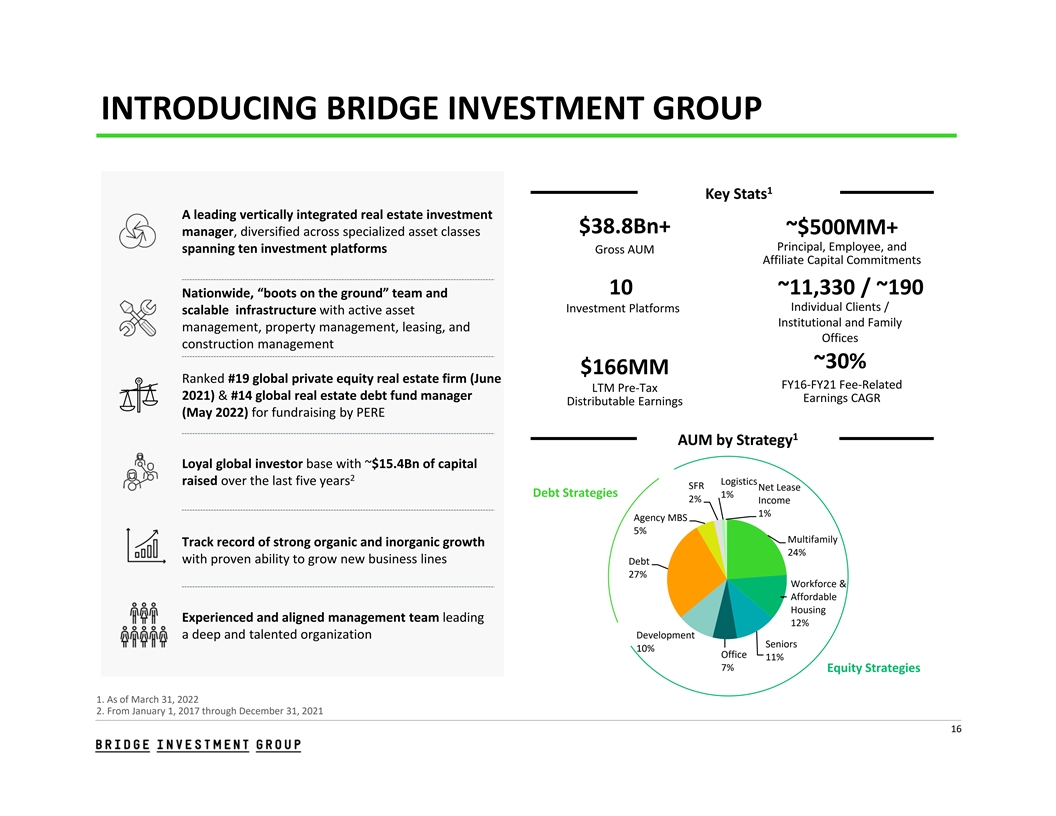
INTRODUCING BRIDGE INVESTMENT GROUP 1 Key Stats A leading vertically integrated real estate investment $38.8Bn+ ~$500MM+ manager, diversified across specialized asset classes Principal, Employee, and spanning ten investment platforms Gross AUM Affiliate Capital Commitments 10 ~11,330 / ~190 Nationwide, “boots on the ground” team and Individual Clients / Investment Platforms scalable infrastructure with active asset Institutional and Family management, property management, leasing, and Offices construction management ~30% $166MM Ranked #19 global private equity real estate firm (June FY16‐FY21 Fee‐Related LTM Pre‐Tax 2021) & #14 global real estate debt fund manager Earnings CAGR Distributable Earnings (May 2022) for fundraising by PERE 1 AUM by Strategy Loyal global investor base with ~$15.4Bn of capital 2 raised over the last five years Logistics SFR Net Lease Debt Strategies 1% 2% Income 1% Agency MBS 5% Multifamily Track record of strong organic and inorganic growth 24% with proven ability to grow new business lines Debt 27% Workforce & Affordable Housing Experienced and aligned management team leading 12% a deep and talented organization Development Seniors 10% Office 11% 7% Equity Strategies 1. As of March 31, 2022 2. From January 1, 2017 through December 31, 2021 16
BRIDGE INVESTMENT GROUP KEY INVESTMENT HIGHLIGHTS Diversified and Synergistic Business Model Spanning Ten Investment Platforms Vertically Integrated Business Model and Scalable Infrastructure Drive Competitive Advantages and Attractive Investment Returns National Footprint with High‐Touch Operating Model and Local Expertise High Proportion of Recurring Fees and “Sticky” Contractual Revenue Streams from Long‐duration Capital Proven Record of Fundraising Success with a Loyal Investor Base Significant Organic and Inorganic Opportunities to Accelerate Growth Long‐tenured Senior Management Team with High Alignment and Support of Deep and Talented Employee Pool Strong Tailwinds from Favorable Market Trends 17
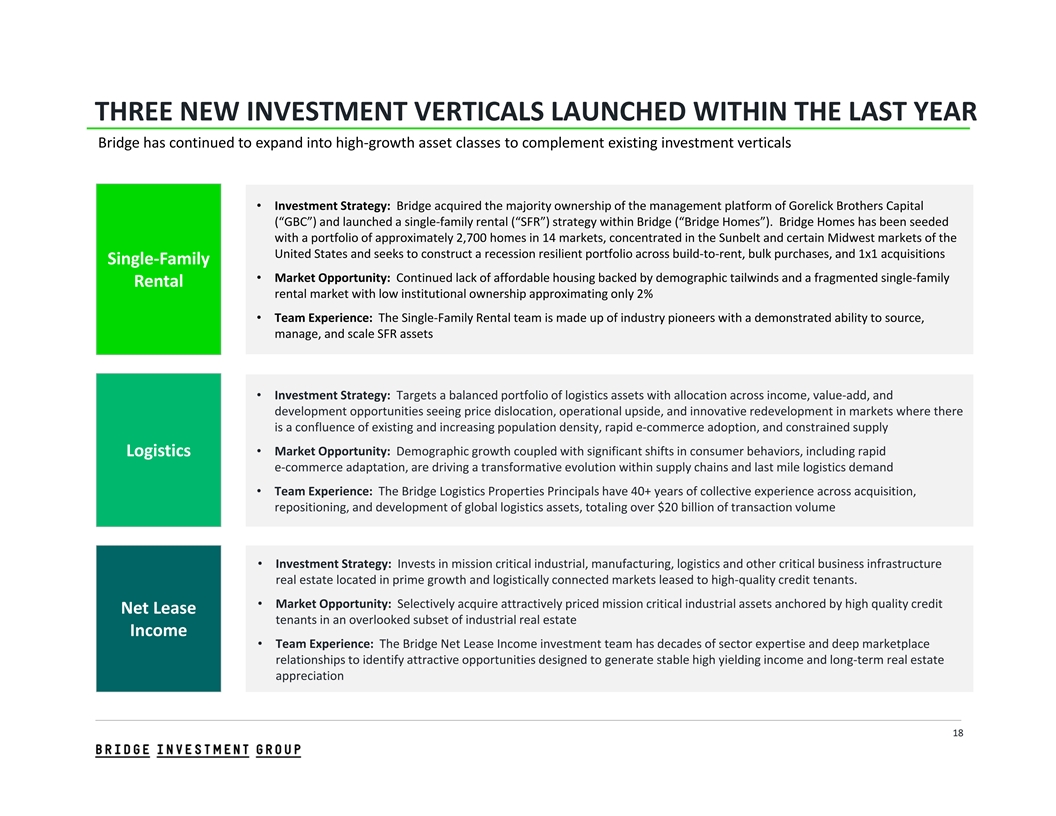
THREE NEW INVESTMENT VERTICALS LAUNCHED WITHIN THE LAST YEAR Bridge has continued to expand into high‐growth asset classes to complement existing investment verticals • Investment Strategy: Bridge acquired the majority ownership of the management platform of Gorelick Brothers Capital (“GBC”) and launched a single‐family rental (“SFR”) strategy within Bridge (“Bridge Homes”). Bridge Homes has been seeded with a portfolio of approximately 2,700 homes in 14 markets, concentrated in the Sunbelt and certain Midwest markets of the United States and seeks to construct a recession resilient portfolio across build‐to‐rent, bulk purchases, and 1x1 acquisitions Single‐Family • Market Opportunity: Continued lack of affordable housing backed by demographic tailwinds and a fragmented single‐family Rental rental market with low institutional ownership approximating only 2% • Team Experience: The Single‐Family Rental team is made up of industry pioneers with a demonstrated ability to source, manage, and scale SFR assets • Investment Strategy: Targets a balanced portfolio of logistics assets with allocation across income, value‐add, and development opportunities seeing price dislocation, operational upside, and innovative redevelopment in markets where there is a confluence of existing and increasing population density, rapid e‐commerce adoption, and constrained supply Logistics • Market Opportunity: Demographic growth coupled with significant shifts in consumer behaviors, including rapid e‐commerce adaptation, are driving a transformative evolution within supply chains and last mile logistics demand • Team Experience: The Bridge Logistics Properties Principals have 40+ years of collective experience across acquisition, repositioning, and development of global logistics assets, totaling over $20 billion of transaction volume • Investment Strategy: Invests in mission critical industrial, manufacturing, logistics and other critical business infrastructure real estate located in prime growth and logistically connected markets leased to high‐quality credit tenants. • Market Opportunity: Selectively acquire attractively priced mission critical industrial assets anchored by high quality credit Net Lease tenants in an overlooked subset of industrial real estate Income • Team Experience: The Bridge Net Lease Income investment team has decades of sector expertise and deep marketplace relationships to identify attractive opportunities designed to generate stable high yielding income and long‐term real estate appreciation 18
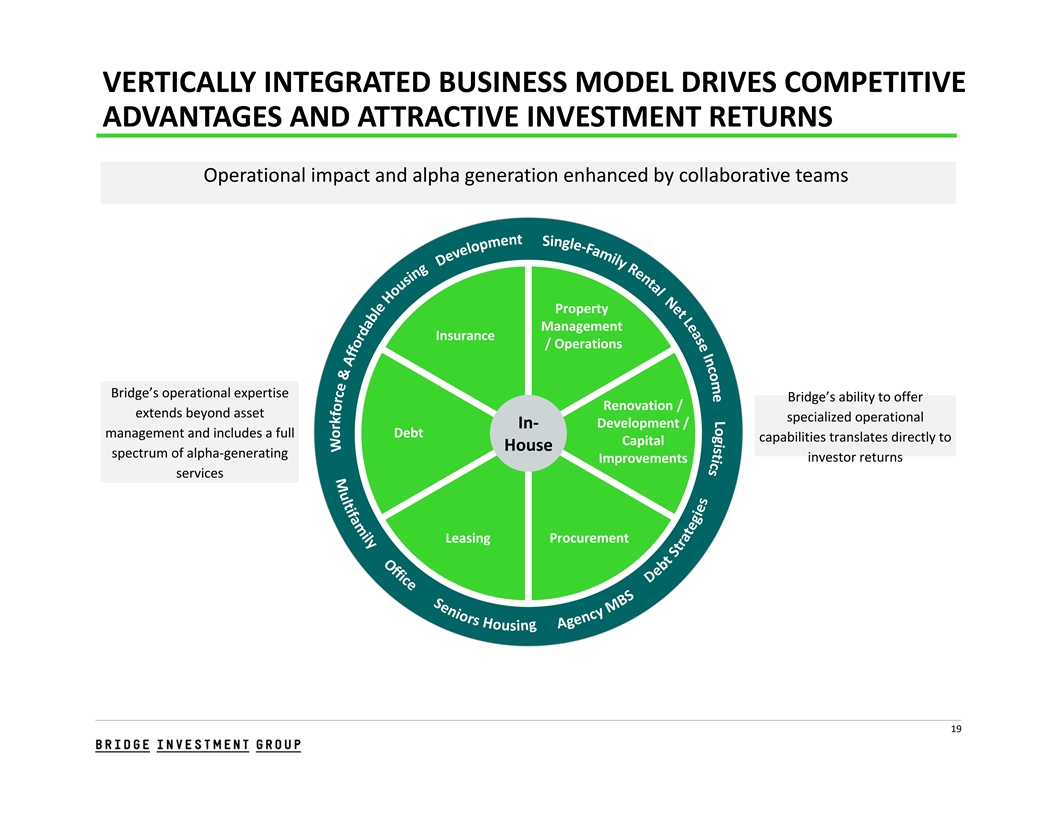
VERTICALLY INTEGRATED BUSINESS MODEL DRIVES COMPETITIVE ADVANTAGES AND ATTRACTIVE INVESTMENT RETURNS Operational impact and alpha generation enhanced by collaborative teams Property Management Insurance / Operations Bridge’s operational expertise Bridge’s ability to offer Renovation / extends beyond asset specialized operational Development / In‐ management and includes a full Debt capabilities translates directly to Capital House spectrum of alpha‐generating investor returns Improvements services Leasing Procurement 19
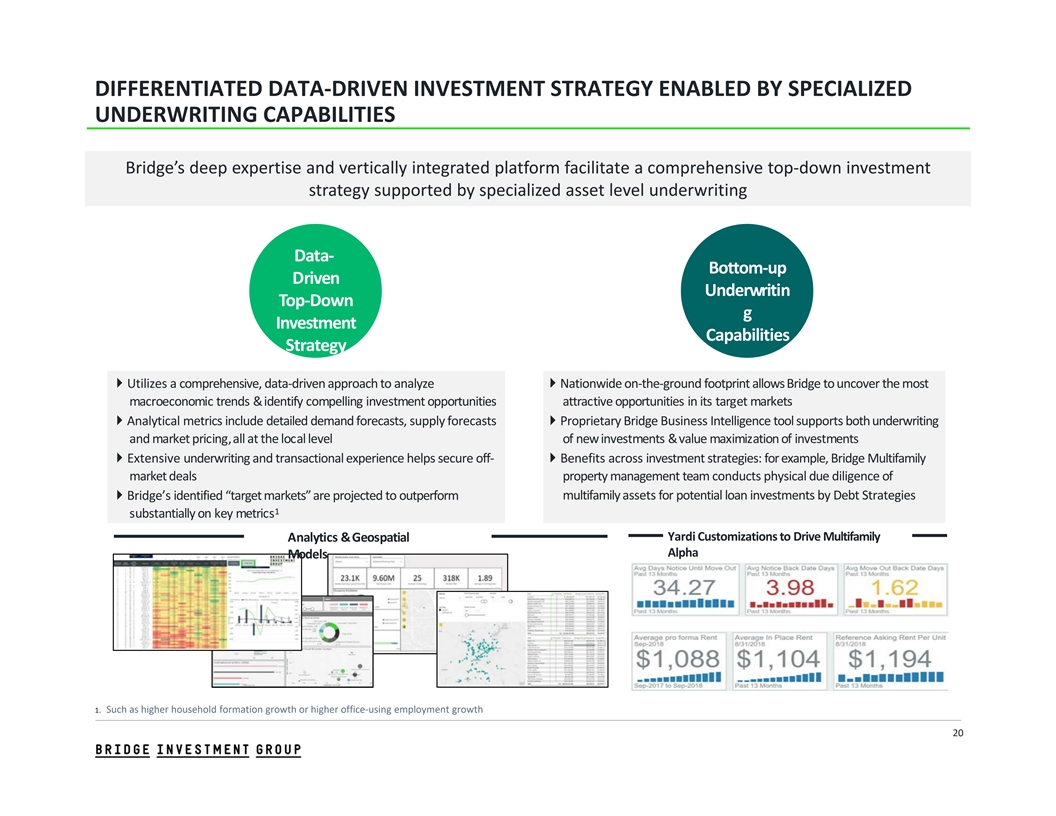
DIFFERENTIATED DATA‐DRIVEN INVESTMENT STRATEGY ENABLED BY SPECIALIZED UNDERWRITING CAPABILITIES Bridge’s deep expertise and vertically integrated platform facilitate a comprehensive top‐down investment strategy supported by specialized asset level underwriting Data‐ Bottom‐up Driven Underwritin Top‐Down g Investment Capabilities Strategy 4Utilizes a comprehensive, data‐driven approach to analyze 4Nationwide on‐the‐ground footprint allows Bridge to uncover the most macroeconomic trends & identify compelling investment opportunities attractive opportunities in its target markets 4Analytical metrics include detailed demand forecasts, supply forecasts 4Proprietary Bridge Business Intelligence tool supports both underwriting and market pricing,all at the local level of new investments & value maximization of investments 4Extensive underwriting and transactional experience helps secure off‐4Benefits across investment strategies: for example, Bridge Multifamily market deals property management team conducts physical due diligence of 4Bridge’s identified “target markets” are projected to outperform multifamily assets for potential loan investments by Debt Strategies 1 substantially on key metrics Analytics & Geospatial Yardi Customizations to Drive Multifamily Alpha Models 1. Such as higher household formation growth or higher office‐using employment growth 20
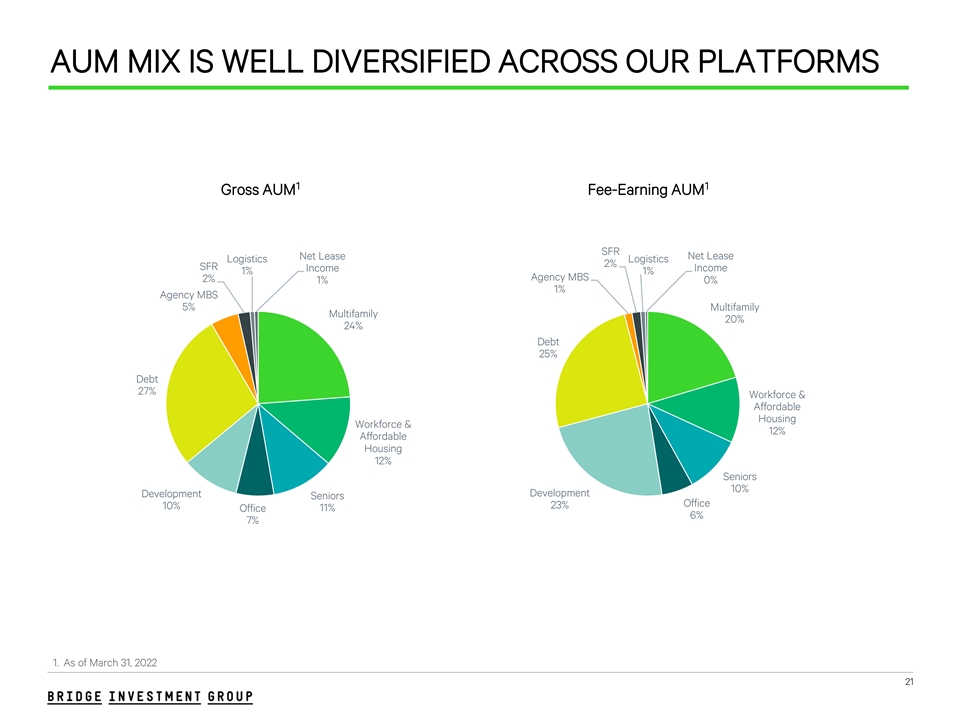
AUM MIX IS WELL DIVERSIFIED ACROSS OUR PLATFORMS 1 1 Gross AUM Fee-Earning AUM SFR Net Lease Net Lease Logistics Logistics 2% SFR Income Income 1% 1% Agency MBS 2% 1% 0% 1% Agency MBS 5% Multifamily Multifamily 20% 24% Debt 25% Debt 27% Workforce & Affordable Housing Workforce & 12% Affordable Housing 12% Seniors 10% Development Development Seniors Office 10% 23% Office 11% 6% 7% 1. As of March 31, 2022 21
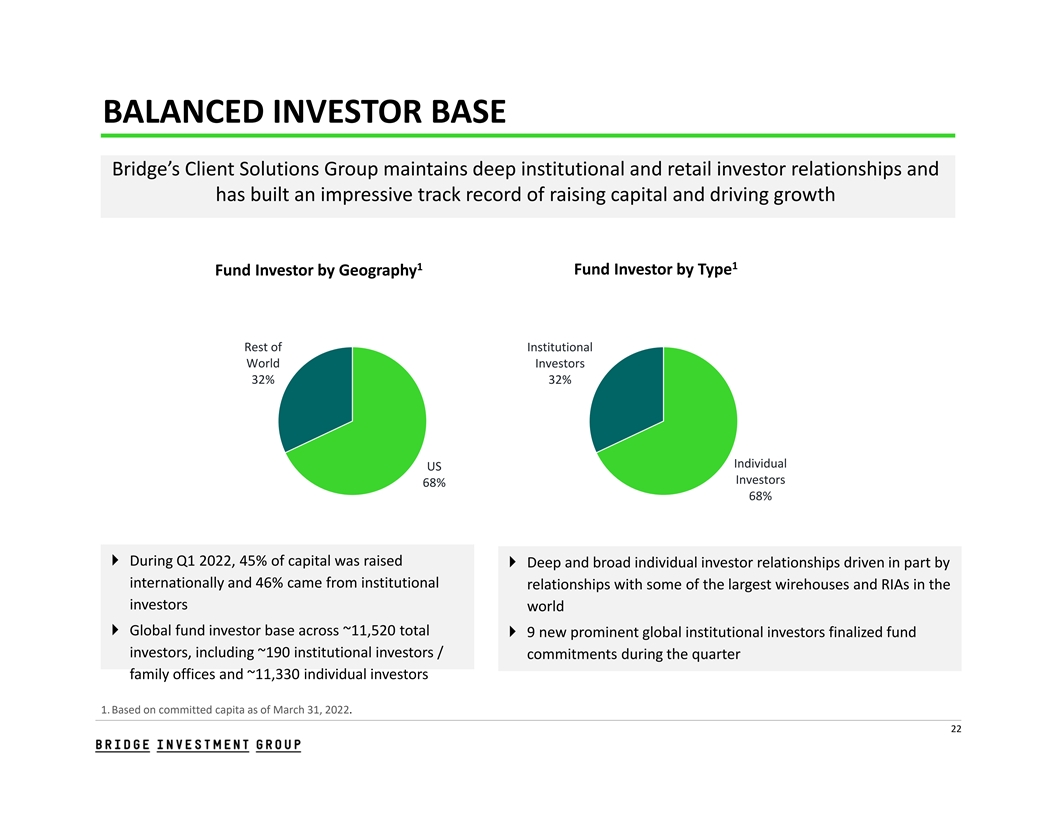
BALANCED INVESTOR BASE Bridge’s Client Solutions Group maintains deep institutional and retail investor relationships and has built an impressive track record of raising capital and driving growth 1 1 Fund Investor by Type Fund Investor by Geography Rest of Institutional World Investors 32% 32% Individual US Investors 68% 68% 4 During Q1 2022, 45% of capital was raised 4 Deep and broad individual investor relationships driven in part by internationally and 46% came from institutional relationships with some of the largest wirehouses and RIAs in the investors world 4 Global fund investor base across ~11,520 total 4 9 new prominent global institutional investors finalized fund investors, including ~190 institutional investors / commitments during the quarter family offices and ~11,330 individual investors 1. Based on committed capita as of March 31, 2022. 22
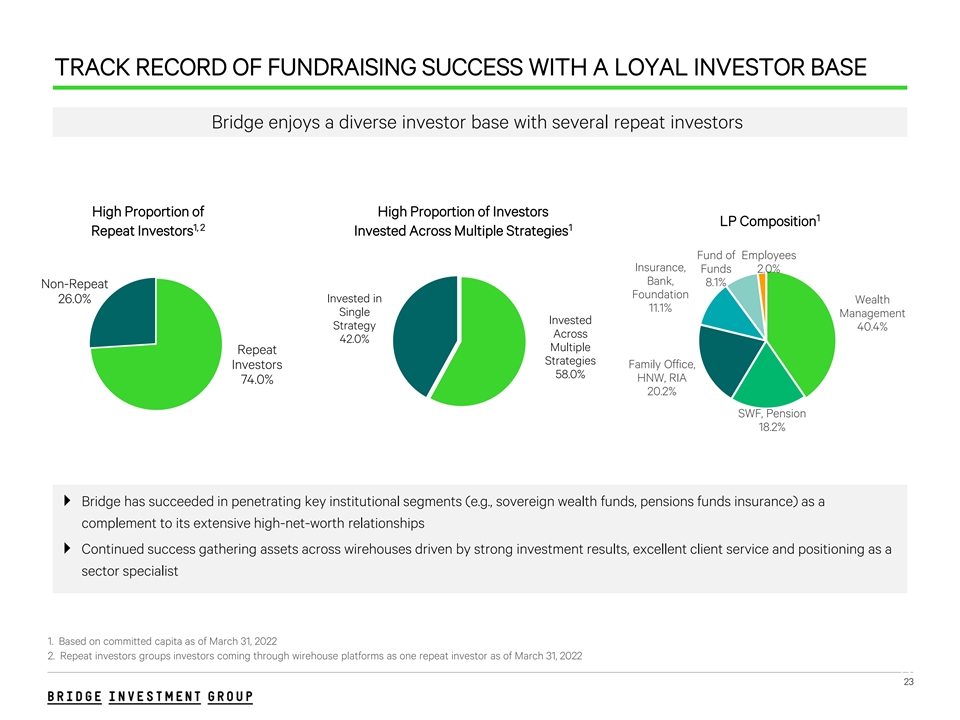
TRACK RECORD OF FUNDRAISING SUCCESS WITH A LOYAL INVESTOR BASE Bridge enjoys a diverse investor base with several repeat investors High Proportion of High Proportion of Investors 1 LP Composition 1, 2 1 Repeat Investors Invested Across Multiple Strategies Fund of Employees Insurance, Funds 2.0% Bank, 8.1% Non-Repeat Foundation Invested in 26.0% Wealth 11.1% Single Management Invested Strategy 40.4% Across 42.0% Multiple Repeat Strategies Family Office, Investors 58.0% HNW, RIA 74.0% 20.2% SWF, Pension 18.2% 4 Bridge has succeeded in penetrating key institutional segments (e.g., sovereign wealth funds, pensions funds insurance) as a complement to its extensive high-net-worth relationships 4 Continued success gathering assets across wirehouses driven by strong investment results, excellent client service and positioning as a sector specialist 1. Based on committed capita as of March 31, 2022 2. Repeat investors groups investors coming through wirehouse platforms as one repeat investor as of March 31, 2022 23 23
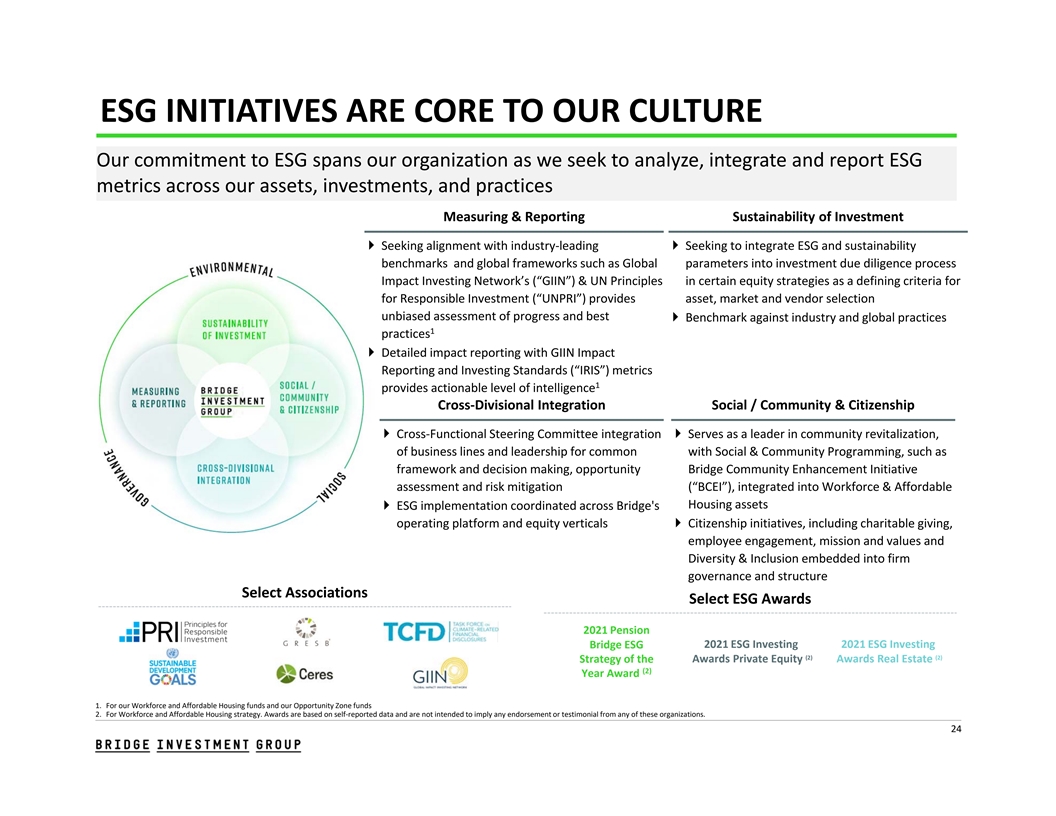
ESG INITIATIVES ARE CORE TO OUR CULTURE Our commitment to ESG spans our organization as we seek to analyze, integrate and report ESG metrics across our assets, investments, and practices Measuring & Reporting Sustainability of Investment 4 Seeking alignment with industry‐leading 4 Seeking to integrate ESG and sustainability benchmarks and global frameworks such as Global parameters into investment due diligence process Impact Investing Network’s (“GIIN”) & UN Principles in certain equity strategies as a defining criteria for for Responsible Investment (“UNPRI”) provides asset, market and vendor selection unbiased assessment of progress and best 4 Benchmark against industry and global practices 1 practices 4 Detailed impact reporting with GIIN Impact Reporting and Investing Standards (“IRIS”) metrics 1 provides actionable level of intelligence Cross‐Divisional Integration Social / Community & Citizenship 4 Cross‐Functional Steering Committee integration 4 Serves as a leader in community revitalization, of business lines and leadership for common with Social & Community Programming, such as framework and decision making, opportunity Bridge Community Enhancement Initiative assessment and risk mitigation (“BCEI”), integrated into Workforce & Affordable Housing assets 4 ESG implementation coordinated across Bridge's operating platform and equity verticals4 Citizenship initiatives, including charitable giving, employee engagement, mission and values and Diversity & Inclusion embedded into firm governance and structure Select Associations Select ESG Awards 2021 Pension Bridge ESG 2021 ESG Investing 2021 ESG Investing (2) (2) Strategy of the Awards Private Equity Awards Real Estate (2) Year Award 1. For our Workforce and Affordable Housing funds and our Opportunity Zone funds 2. For Workforce and Affordable Housing strategy. Awards are based on self‐reported data and are not intended to imply any endorsement or testimonial from any of these organizations. 24
APPENDIX
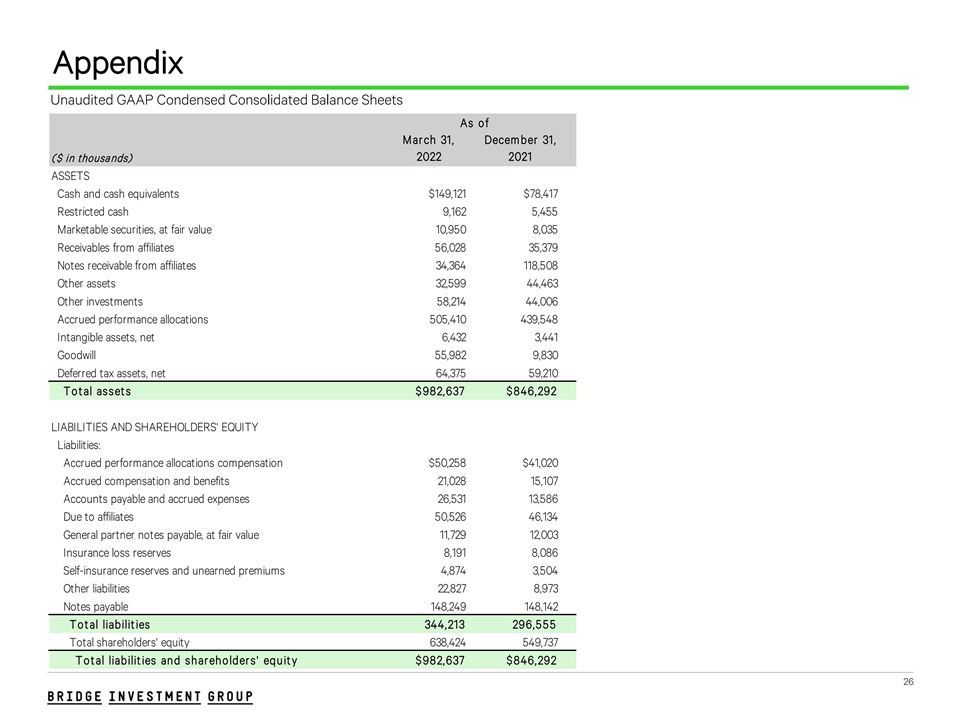
Appendix Unaudited GAAP Condensed Consolidated Balance Sheets As of Mar ch 31, Decem ber 31, 2022 2021 ( $ in thousands) ASSETS Cash and cash equivalents $149,121 $78,417 Restricted cash 9,162 5,455 Marketable securities, at fair value 10,950 8,035 Receivables from affiliates 56,028 35,379 Notes receivable from affiliates 34,364 118,508 Other assets 32,599 44, 463 Other investments 58,214 44,006 Accrued performance allocations 505,410 439,548 Intangible assets, net 6,432 3,441 Goodwill 55,982 9,830 Deferred tax assets, net 64,375 59,210 Tot al asset s $ 982,637 $ 846,292 LIABILITIES AND SHAREHOLDERS' EQUITY Liabilities: Accrued performance allocations compensation $50,258 $41,020 Accrued compensation and benefits 21,028 15,107 Accounts payable and accrued expenses 26,531 13,586 Due to affiliates 50,526 46,134 General partner notes payable, at fair value 11,729 12 ,003 Insurance loss reserves 8,191 8,086 Self-insurance reserves and unearned premiums 4,874 3,504 Other liabilities 22,827 8,973 Notes payable 148 ,249 148,142 Tot al liabilit ies 344,213 296,5 5 5 Total shareholders' equity 638,424 549,737 Tot al liabilit ies and shar eholder s' equit y $ 982,637 $ 846,292 26
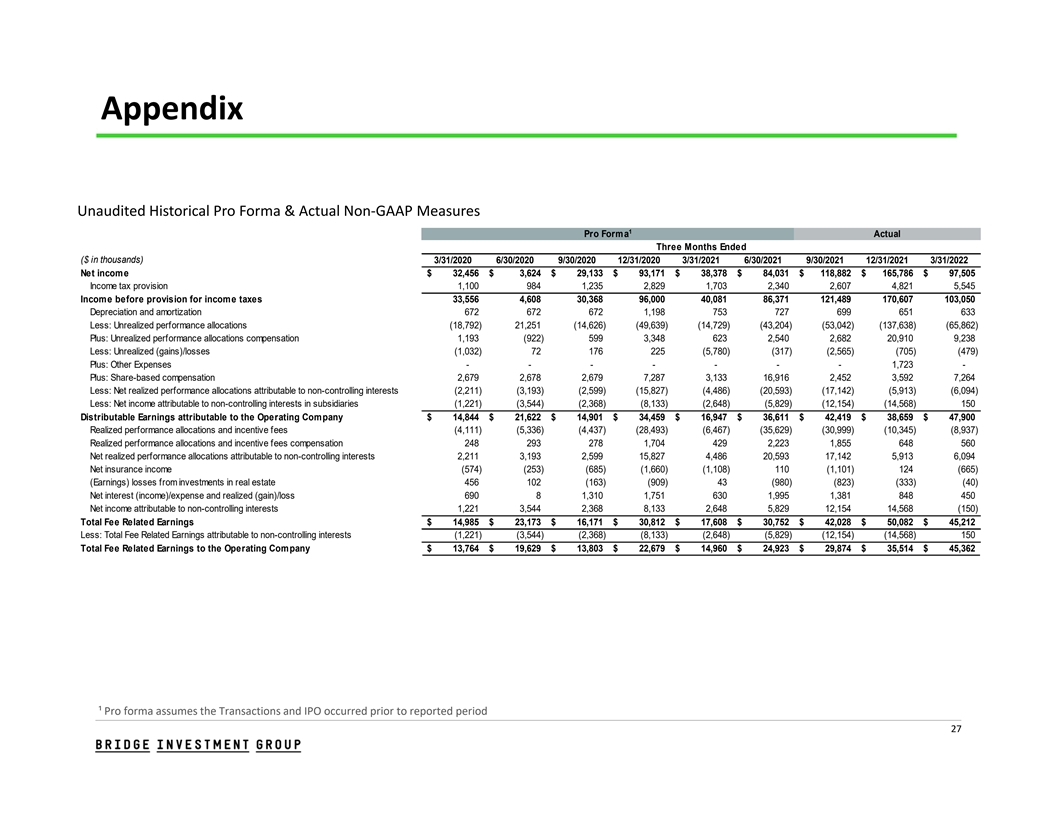
Appendix Unaudited Historical Pro Forma & Actual Non‐GAAP Measures 1 Pro Forma Actual Three Months Ended ($ in thousands) 3/31/2020 6/30/2020 9/30/2020 12/31/2020 3/31/2021 6/30/2021 9/30/2021 12/31/2021 3/31/2022 Net incom e $ 32,456 $ 3,624 $ 29,133 $ 93,171 $ 38,378 $ 84,031 $ 118,882 $ 165,786 $ 97,505 Income tax provision 1,100 984 1,235 2,829 1,703 2,340 2,607 4,821 5,545 Income before provision for income taxes 33,556 4,608 30,368 96,000 40,081 86,371 121,489 170,607 103,050 Depreciation and amortization 672 672 672 1,198 753 727 699 651 633 Less: Unrealized performance allocations (18,792) 21,251 (14,626) (49,639) (14,729) (43,204) (53,042) (137,638) (65,862) Plus: Unrealized performance allocations compensation 1,193 (922) 599 3,348 623 2,540 2,682 20,910 9,238 Less: Unrealized (gains)/losses (1,032) 72 176 225 (5,780) (317) (2,565) (705) (479) Plus: Other Expenses - - - - - - - 1,723 - Plus: Share-based compensation 2,679 2,678 2,679 7,287 3,133 16,916 2,452 3,592 7,264 Less: Net realized performance allocations attributable to non-controlling interests (2,211) (3,193) (2,599) (15,827) (4,486) (20,593) (17,142) (5,913) (6,094) Less: Net income attributable to non-controlling interests in subsidiaries (1,221) (3,544) (2,368) (8,133) (2,648) (5,829) (12,154) (14,568) 150 Distributable Earnings attributable to the Operating Company $ 14,844 $ 21,622 $ 14,901 $ 34,459 $ 16,947 $ 36,611 $ 42,419 $ 38,659 $ 47,900 Realized performance allocations and incentive fees (4,111) (5,336) (4,437) (28,493) (6,467) (35,629) (30,999) (10,345) (8,937) Realized performance allocations and incentive fees compensation 248 293 278 1,704 429 2,223 1,855 648 560 Net realized performance allocations attributable to non-controlling interests 2,211 3,193 2,599 15,827 4,486 20,593 17,142 5,913 6,094 Net insurance income (574) (253) (685) (1,660) (1,108) 110 (1,101) 124 (665) (Earnings) losses from investments in real estate 456 102 (163) (909) 4 3 (980) (823) (333) (40) Net interest (income)/expense and realized (gain)/loss 690 8 1,310 1,751 630 1,995 1,381 848 450 Net income attributable to non-controlling interests 1,221 3,544 2,368 8,133 2,648 5,829 12,154 14,568 (150) Total Fee Related Earnings $ 14,985 $ 23,173 $ 16,171 $ 30,812 $ 17,608 $ 30,752 $ 42,028 $ 50,082 $ 45,212 Less: Total Fee Related Earnings attributable to non-controlling interests (1,221) (3,544) (2,368) (8,133) (2,648) (5,829) (12,154) (14,568) 150 Total Fee Related Earnings to the Operating Company $ 13,764 $ 19,629 $ 13,803 $ 22,679 $ 14,960 $ 24,923 $ 29,874 $ 35,514 $ 45,362 ¹ Pro forma assumes the Transactions and IPO occurred prior to reported period 27
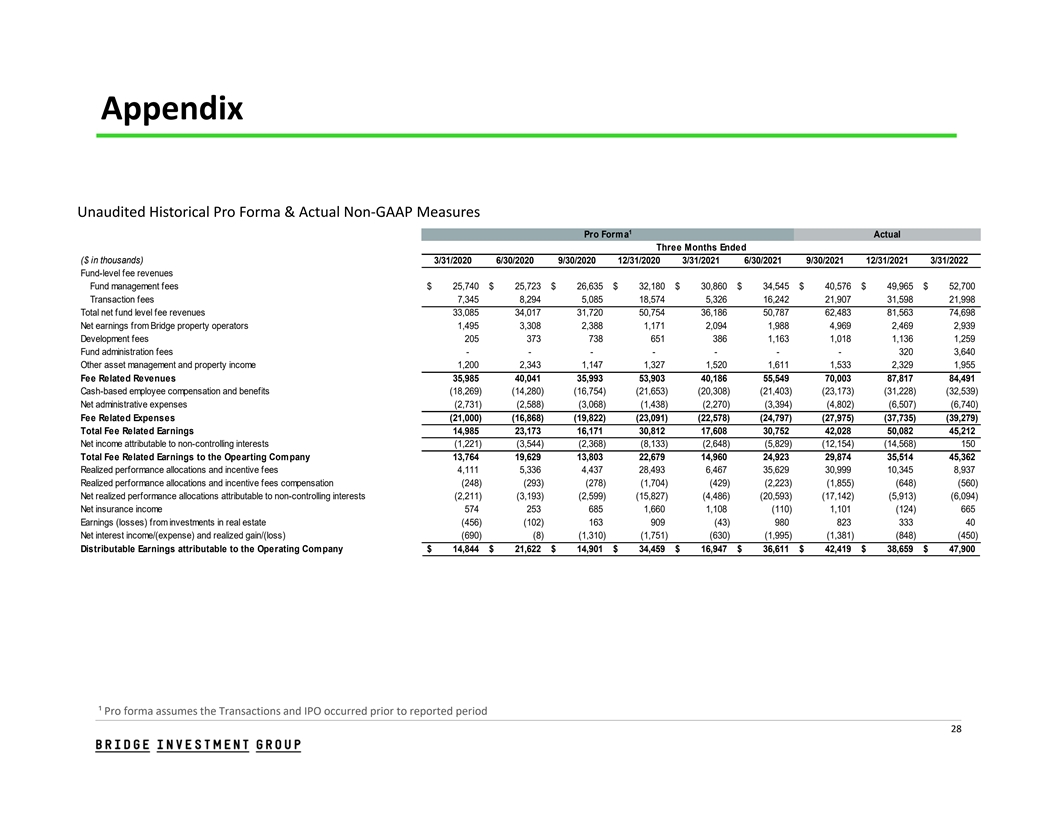
Appendix Unaudited Historical Pro Forma & Actual Non‐GAAP Measures 1 Pro Forma Actual Three Months Ended ($ in thousands) 3/31/2020 6/30/2020 9/30/2020 12/31/2020 3/31/2021 6/30/2021 9/30/2021 12/31/2021 3/31/2022 Fund-level fee revenues Fund management fees $ 25,740 $ 25,723 $ 26,635 $ 32,180 $ 30,860 $ 34,545 $ 40,576 $ 49,965 $ 52,700 Transaction fees 7,345 8,294 5,085 18,574 5,326 16,242 21,907 31,598 21,998 Total net fund level fee revenues 33,085 34,017 31,720 50,754 36,186 50,787 62,483 81,563 74,698 Net earnings from Bridge property operators 1,495 3,308 2,388 1,171 2,094 1,988 4,969 2,469 2,939 Development fees 205 373 738 651 386 1,163 1,018 1,136 1,259 Fund administration fees - - - - - - - 320 3,640 Other asset management and property income 1,200 2,343 1,147 1,327 1,520 1,611 1,533 2,329 1,955 Fee Related Revenues 35,985 40,041 35,993 53,903 40,186 55,549 70,003 87,817 84,491 Cash-based employee compensation and benefits (18,269) (14,280) (16,754) (21,653) (20,308) (21,403) (23,173) (31,228) (32,539) Net administrative expenses (2,731) (2,588) (3,068) (1,438) (2,270) (3,394) (4,802) (6,507) (6,740) Fee Related Expenses (21,000) (16,868) (19,822) (23,091) (22,578) (24,797) (27,975) (37,735) (39,279) Total Fee Related Earnings 14,985 23,173 16,171 30,812 17,608 30,752 42,028 50,082 45,212 Net income attributable to non-controlling interests (1,221) (3,544) (2,368) (8,133) (2,648) (5,829) (12,154) (14,568) 150 Total Fee Related Earnings to the Opearting Company 13,764 19,629 13,803 22,679 14,960 24,923 29,874 35,514 45,362 Realized performance allocations and incentive fees 4,111 5,336 4,437 28,493 6,467 35,629 30,999 10,345 8,937 Realized performance allocations and incentive fees compensation (248) (293) (278) (1,704) (429) (2,223) (1,855) (648) (560) Net realized performance allocations attributable to non-controlling interests (2,211) (3,193) (2,599) (15,827) (4,486) (20,593) (17,142) (5,913) (6,094) Net insurance income 574 253 685 1,660 1,108 (110) 1,101 (124) 665 Earnings (losses) from investments in real estate (456) (102) 163 909 (43) 980 823 333 4 0 Net interest income/(expense) and realized gain/(loss) (690) (8) (1,310) (1,751) (630) (1,995) (1,381) (848) (450) Distributable Earnings attributable to the Operating Company $ 14,844 $ 21,622 $ 14,901 $ 34,459 $ 16,947 $ 36,611 $ 42,419 $ 38,659 $ 47,900 ¹ Pro forma assumes the Transactions and IPO occurred prior to reported period 28
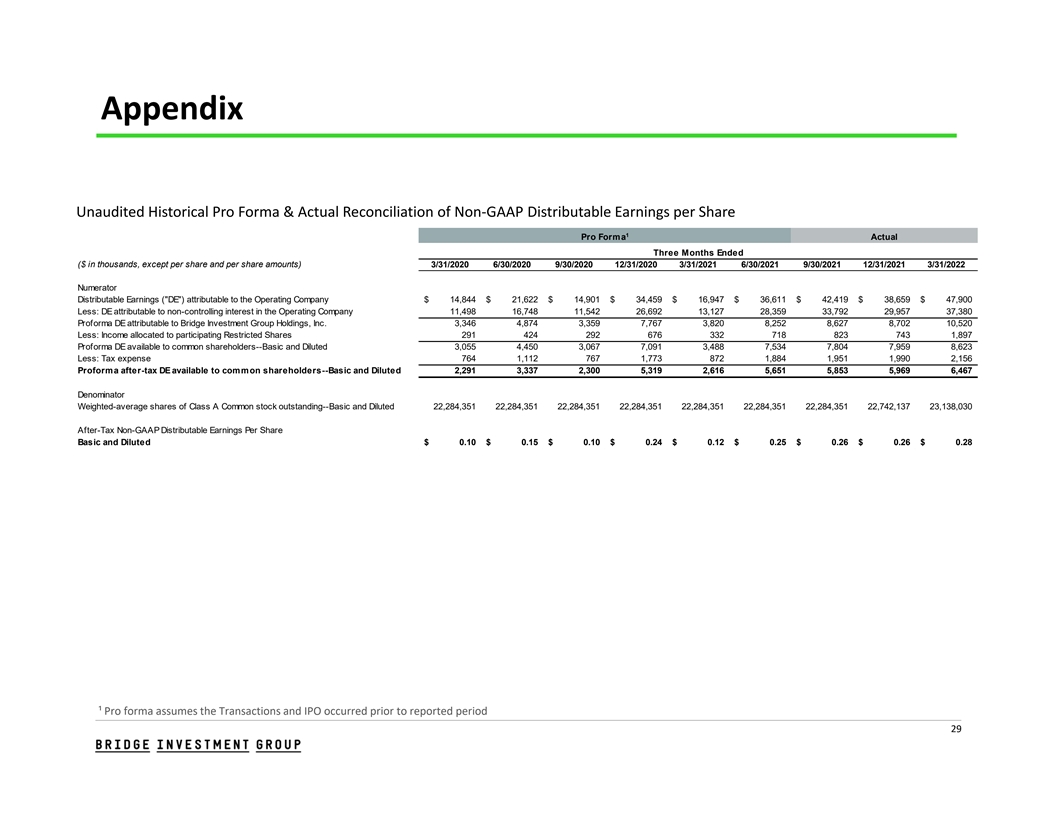
Appendix Unaudited Historical Pro Forma & Actual Reconciliation of Non‐GAAP Distributable Earnings per Share 1 Pro Forma Actual Three Months Ended ($ in thousands, except per share and per share amounts) 3/31/2020 6/30/2020 9/30/2020 12/31/2020 3/31/2021 6/30/2021 9/30/2021 12/31/2021 3/31/2022 Numerator Distributable Earnings ( DE ) attributable to the Operating Company $ 1 4,844 $ 21,622 $ 14,901 $ 34,459 $ 16,947 $ 36,611 $ 42,419 $ 38,659 $ 47,900 Less: DE attributable to non-controlling interest in the Operating Company 1 1,498 16,748 11,542 26,692 13,127 28,359 33,792 29,957 37,380 Proforma DE attributable to Bridge Investment Group Holdings, Inc. 3,346 4,874 3,359 7,767 3,820 8,252 8,627 8,702 10,520 Less: Income allocated to participating Restricted Shares 291 424 292 676 332 718 823 743 1,897 Proforma DE available to common shareholders--Basic and Diluted 3,055 4,450 3,067 7,091 3,488 7,534 7,804 7,959 8,623 Less: Tax expense 764 1,112 767 1,773 8 72 1,884 1,951 1,990 2,156 Proforma after-tax DE available to common shareholders--Basic and Diluted 2,291 3,337 2,300 5,319 2,616 5,651 5,853 5,969 6,467 Denominator Weighted-average shares of Class A Common stock outstanding--Basic and Diluted 22,284,351 22,284,351 22,284,351 22,284,351 22,284,351 22,284,351 22,284,351 22,742,137 23,138,030 After-Tax Non-GAAP Distributable Earnings Per Share Basic and Diluted $ 0.10 $ 0.15 $ 0.10 $ 0.24 $ 0.12 $ 0.25 $ 0.26 $ 0.26 $ 0.28 ¹ Pro forma assumes the Transactions and IPO occurred prior to reported period 29
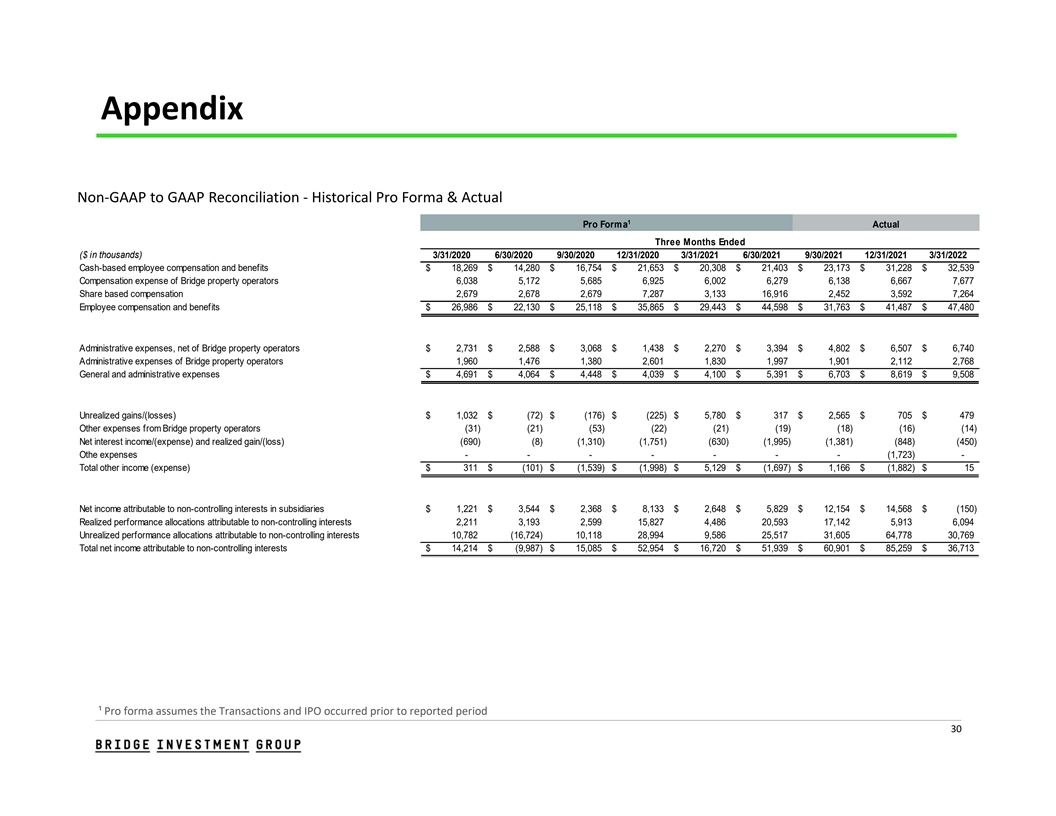
Appendix Non‐GAAP to GAAP Reconciliation ‐ Historical Pro Forma & Actual 1 Pro Forma Actual Three Months Ended ($ in thousands) 3/31/2020 6/30/2020 9/30/2020 12/31/2020 3/31/2021 6/30/2021 9/30/2021 12/31/2021 3/31/2022 Cash-based employee compensation and benefits $ 18,269 $ 14,280 $ 16,754 $ 21,653 $ 20,308 $ 21,403 $ 23,173 $ 31,228 $ 32,539 Compensation expense of Bridge property operators 6,038 5,172 5,685 6,925 6,002 6,279 6,138 6,667 7,677 Share based compensation 2,679 2,678 2,679 7,287 3,133 16,916 2,452 3,592 7,264 Employee compensation and benefits $ 26,986 $ 22,130 $ 25,118 $ 35,865 $ 29,443 $ 44,598 $ 31,763 $ 41,487 $ 47,480 Administrative expenses, net of Bridge property operators $ 2,731 $ 2,588 $ 3,068 $ 1,438 $ 2,270 $ 3,394 $ 4,802 $ 6,507 $ 6,740 Administrative expenses of Bridge property operators 1,960 1,476 1,380 2,601 1,830 1,997 1,901 2,112 2,768 General and administrative expenses $ 4,691 $ 4,064 $ 4,448 $ 4,039 $ 4,100 $ 5,391 $ 6,703 $ 8,619 $ 9,508 Unrealized gains/(losses) $ 1,032 $ (72) $ (176) $ (225) $ 5,780 $ 317 $ 2,565 $ 705 $ 479 Other expenses from Bridge property operators (31) (21) (53) (22) (21) (19) (18) (16) (14) Net interest income/(expense) and realized gain/(loss) (690) (8) (1,310) (1,751) (630) (1,995) (1,381) (848) (450) Othe expenses - - - - - - - (1,723) - Total other income (expense) $ 311 $ (101) $ (1,539) $ (1,998) $ 5,129 $ (1,697) $ 1,166 $ (1,882) $ 1 5 Net income attributable to non-controlling interests in subsidiaries $ 1,221 $ 3,544 $ 2,368 $ 8,133 $ 2,648 $ 5,829 $ 12,154 $ 14,568 $ (150) Realized performance allocations attributable to non-controlling interests 2,211 3,193 2,599 15,827 4,486 20,593 17,142 5,913 6,094 Unrealized performance allocations attributable to non-controlling interests 10,782 (16,724) 10,118 28,994 9,586 25,517 31,605 64,778 30,769 Total net income attributable to non-controlling interests $ 14,214 $ (9,987) $ 15,085 $ 52,954 $ 16,720 $ 51,939 $ 60,901 $ 85,259 $ 36,713 ¹ Pro forma assumes the Transactions and IPO occurred prior to reported period 30
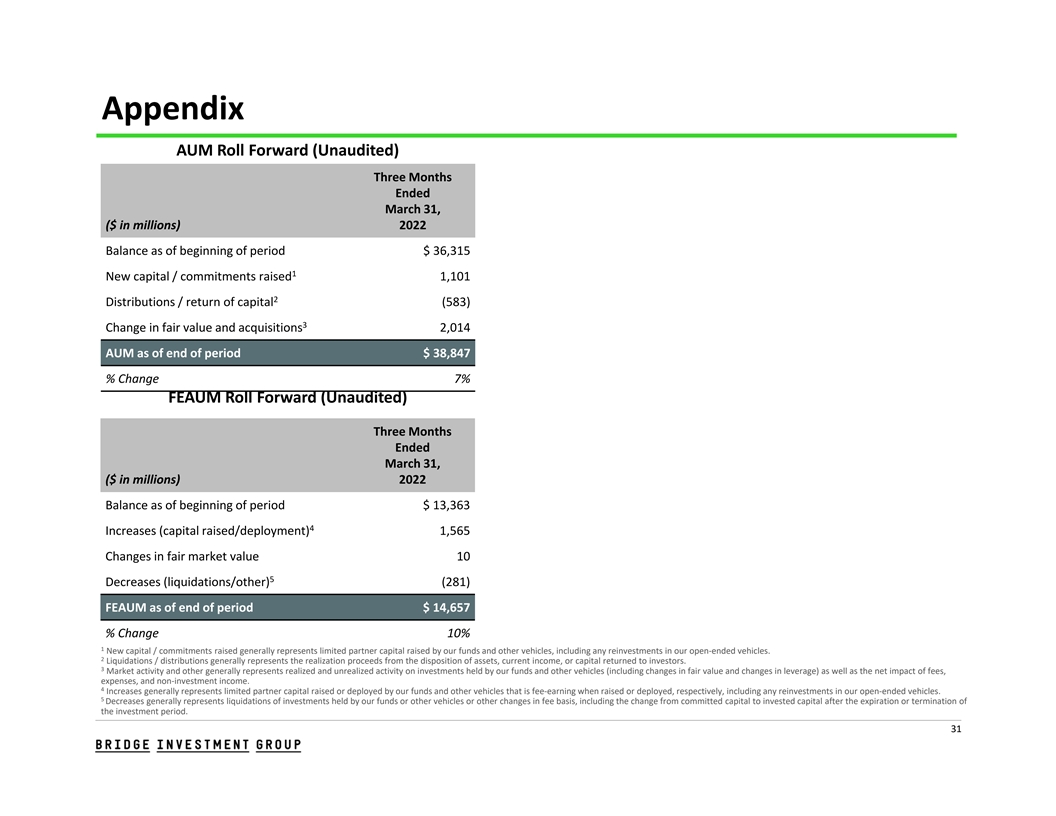
Appendix AUM Roll Forward (Unaudited) Three Months Ended March 31, ($ in millions) 2022 Balance as of beginning of period $ 36,315 1 New capital / commitments raised 1,101 2 Distributions / return of capital (583) 3 Change in fair value and acquisitions 2,014 AUM as of end of period $ 38,847 % Change 7% FEAUM Roll Forward (Unaudited) Three Months Ended March 31, ($ in millions) 2022 Balance as of beginning of period $ 13,363 4 Increases (capital raised/deployment) 1,565 Changes in fair market value 10 5 Decreases (liquidations/other) (281) FEAUM as of end of period $ 14,657 % Change 10% 1 New capital / commitments raised generally represents limited partner capital raised by our funds and other vehicles, including any reinvestments in our open‐ended vehicles. 2 Liquidations / distributions generally represents the realization proceeds from the disposition of assets, current income, or capital returned to investors. 3 Market activity and other generally represents realized and unrealized activity on investments held by our funds and other vehicles (including changes in fair value and changes in leverage) as well as the net impact of fees, expenses, and non‐investment income. 4 Increases generally represents limited partner capital raised or deployed by our funds and other vehicles that is fee‐earning when raised or deployed, respectively, including any reinvestments in our open‐ended vehicles. 5 Decreases generally represents liquidations of investments held by our funds or other vehicles or other changes in fee basis, including the change from committed capital to invested capital after the expiration or termination of the investment period. 31
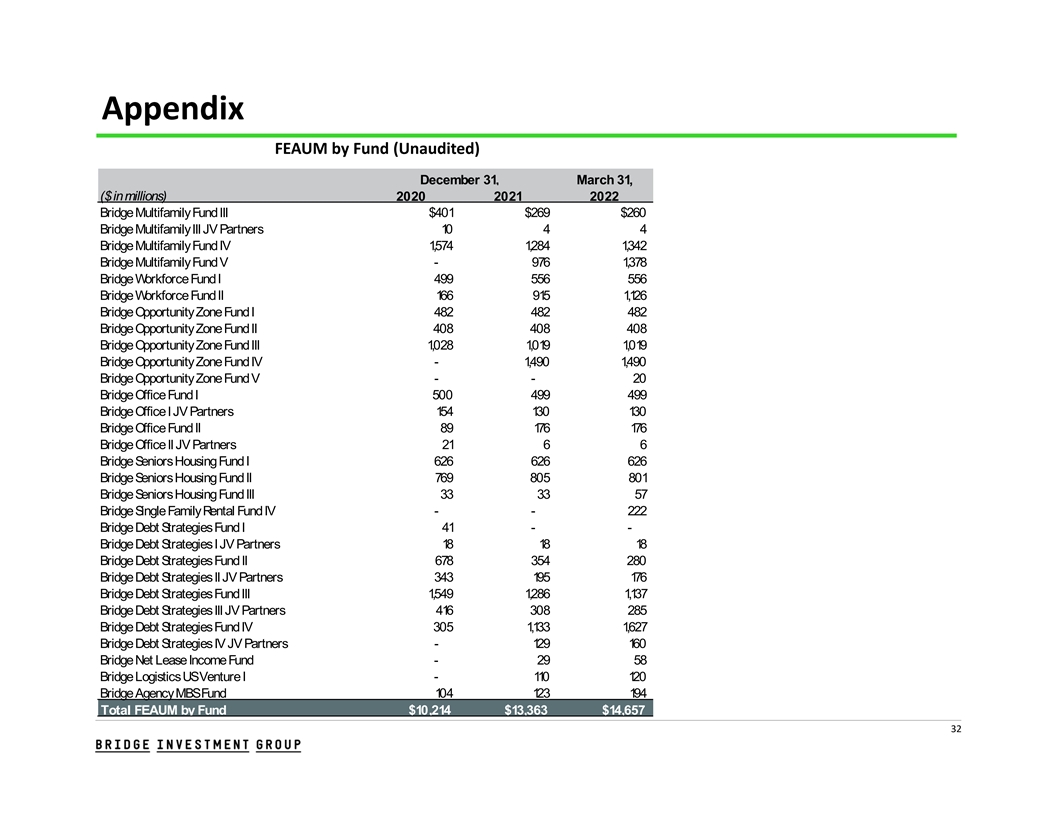
Appendix FEAUM by Fund (Unaudited) December 31, March 31, ($ in millions) 2020 2021 2022 Bridge Multifamily Fund III $401 $269 $260 Bridge Multifamily III JV Partners 1 0 4 4 Bridge Multifamily Fund IV 1 ,574 1 ,284 1 ,342 Bridge Multifamily Fund V - 976 1 ,378 Bridge W orkforce Fund I 499 556 556 Bridge W orkforce Fund II 1 66 91 5 1 ,1 26 Bridge Opportunity Zone Fund I 482 482 482 Bridge Opportunity Zone Fund II 408 408 408 Bridge Opportunity Zone Fund III 1 ,028 1 ,01 9 1 ,01 9 Bridge Opportunity Zone Fund IV - 1 ,490 1 ,490 Bridge Opportunity Zone Fund V - - 20 Bridge Office Fund I 500 499 499 Bridge Office I JV Partners 1 54 1 30 1 30 Bridge Office Fund II 89 1 76 1 76 Bridge Office II JV Partners 21 6 6 Bridge S eniors Housing Fund I 626 626 626 Bridge S eniors Housing Fund II 769 805 801 Bridge S eniors Housing Fund III 33 33 57 Bridge S ingle Family Rental Fund IV - - 222 Bridge Debt S trategies Fund I 41 - - Bridge Debt S trategies I JV Partners 1 8 1 8 1 8 Bridge Debt S trategies Fund II 678 354 280 Bridge Debt S trategies II JV Partners 343 1 95 1 76 Bridge Debt S trategies Fund III 1 ,549 1 ,286 1 ,1 37 Bridge Debt S trategies III JV Partners 41 6 308 285 Bridge Debt S trategies Fund IV 305 1 ,1 33 1 ,627 Bridge Debt S trategies IV JV Partners - 1 29 1 60 Bridge Net Lease Income Fund - 29 58 Bridge Logistics US Venture I - 1 1 0 1 20 Bridge Agency MBS Fund 1 04 1 23 1 94 Total FEAUM by Fund $10,214 $13,363 $14,657 32
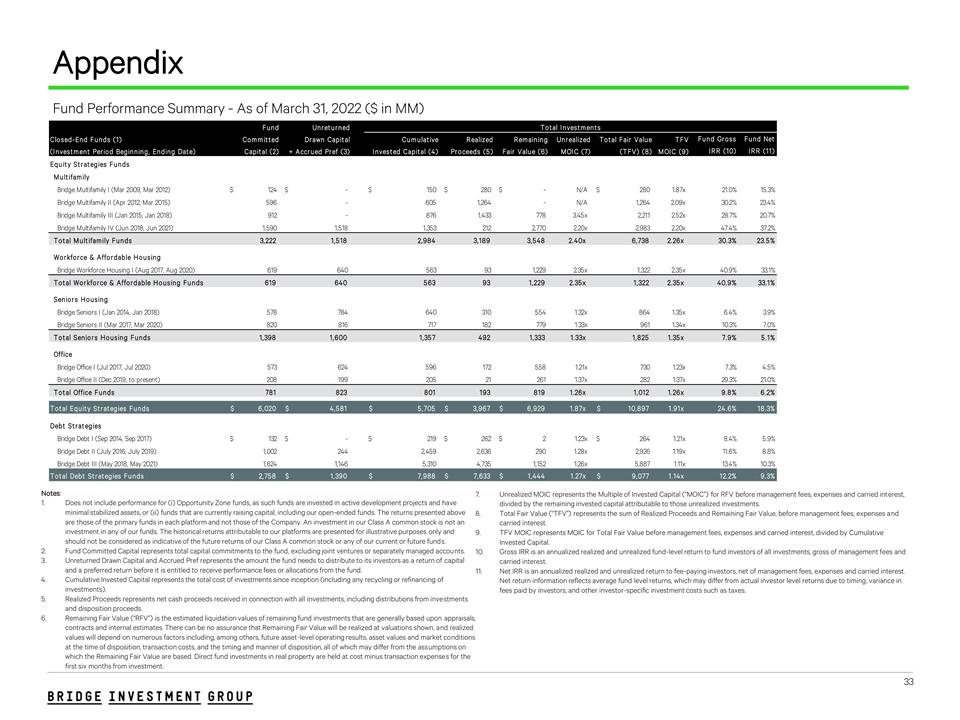
Appendix Fund Performance Summary - As of March 31, 2022 ($ in MM) Fund Unr et ur ned Tot al I nvest m ent s Fund Gr oss Fund Net Closed-End Funds (1) Com m it t ed Dr awn Capit al Cum ulat ive R ealized R em aining Unr ealized Tot al Fair Value TFV I R R (10) I R R (11) (I nvest m ent Per iod Beginning, Ending Dat e) Capit al (2) + Accr ued Pr ef (3) I nvest ed Capit al (4) Pr oceeds (5 ) Fair Value (6) MOI C (7) (TFV) (8) MOI C (9) Equit y St r at egies Funds Mult ifam ily Bridge Multifamily I (Mar 2009, Mar 2012) $ 124 $ - $ 150 $ 280 $ - N/A $ 2 80 1.87x 21.0% 15.3% Bridge Multifamily II (Apr 2012, Mar 2015) 5 96 - 605 1,264 - N/A 1, 264 2.09x 30.2% 23.4% Bridge Multifamily III (Jan 2015, Jan 2018) 912 - 876 1,433 778 3.45x 2,211 2.52x 28.7% 20.7% Bridge Multifamily IV (Jun 2018, Jun 2021) 1, 590 1,518 1,353 212 2,770 2.20x 2,983 2.20x 47.4% 37.2% Tot al Mult ifam ily Funds 3,222 1 ,5 18 2,984 3,189 3,5 48 2.40x 6,738 2.26x 30.3% 23.5 % Wor kfor ce & Affor dable Housing Bridge Workforce Housing I (Aug 2017, Aug 2020) 619 6 40 563 93 1,229 2.35x 1,322 2.35x 40.9% 33.1% Tot al Wor kfor ce & Affor dable Housing Funds 619 640 5 63 93 1,229 2.35 x 1,322 2.35 x 40.9% 33.1% Senior s Housing Bridge Seniors I (Jan 2014, Jan 2018) 578 784 640 3 10 554 1.32x 864 1.35x 6.4% 3.9% Bridge Seniors II (Mar 2017, Mar 2020) 820 816 717 18 2 779 1.33x 961 1.34x 10.3% 7.0% Tot al Senior s Housing Funds 1,398 1,600 1 ,35 7 4 92 1,333 1.33x 1,825 1.35 x 7.9% 5 .1% Office Bridge Office I (Jul 2017, Jul 2020) 573 624 596 172 558 1.21x 730 1.23x 7.3% 4.5% Bridge Office II (Dec 2019, to present) 208 199 2 05 21 261 1.37x 282 1.37x 29.3% 21.0% Tot al Office Funds 781 8 23 8 01 193 819 1.26x 1,012 1.26x 9.8% 6.2% Tot al Equit y St r at egies Funds $ 6,020 $ 4,5 81 $ 5 ,705 $ 3,967 $ 6,929 1.87x $ 10,897 1.91x 24.6% 18.3% Debt St r at egies Bridge Debt I (Sep 2014, Sep 2017) $ 132 $ - $ 219 $ 262 $ 2 1.23x $ 264 1.21x 8.4% 5.9% Bridge Debt II (July 2016, July 2019) 1,002 244 2,459 2,636 290 1.28x 2,926 1.19x 11.6% 8.8% Bridge Debt III (May 2018, May 2021) 1,624 1,146 5,310 4, 735 1, 152 1.26x 5,887 1.11x 13.4% 10.3% Tot al Debt St r at egies Funds $ 2,75 8 $ 1,390 $ 7,988 $ 7,633 $ 1,444 1.27x $ 9,077 1.14x 12.2% 9.3% Notes: 7. Unrealized MOIC represents the Multiple of Invested Capital (“MOIC”) for RFV before management fees, expenses and carried interest, 1. Does not include performance for (i) Opportunity Zone funds, as such funds are invested in active development projects and have divided by the remaining invested capital attributable to those unrealized investments. minimal stabilized assets, or (ii) funds that are currently raising capital, including our open-ended funds. The returns presented above 8. Total Fair Value (“TFV”) represents the sum of Realized Proceeds and Remaining Fair Value, before management fees, expenses and are those of the primary funds in each platform and not those of the Company. An investment in our Class A common stock is not an carried interest. investment in any of our funds. The historical returns attributable to our platforms are presented for illustrative purposes only and 9. TFV MOIC represents MOIC for Total Fair Value before management fees, expenses and carried interest, divided by Cumulative should not be considered as indicative of the future returns of our Class A common stock or any of our current or future funds. Invested Capital. 2. Fund Committed Capital represents total capital commitments to the fund, excluding joint ventures or separately managed accounts. 10. Gross IRR is an annualized realized and unrealized fund-level return to fund investors of all investments, gross of management fees and 3. Unreturned Drawn Capital and Accrued Pref represents the amount the fund needs to distribute to its investors as a return of capital carried interest. and a preferred return before it is entitled to receive performance fees or allocations from the fund. 11. Net IRR is an annualized realized and unrealized return to fee-paying investors, net of management fees, expenses and carried interest. 4. Cumulative Invested Capital represents the total cost of investments since inception (including any recycling or refinancing of Net return information reflects average fund level returns, which may differ from actual investor level returns due to timing, variance in investments). fees paid by investors, and other investor-specific investment costs such as taxes. 5. Realized Proceeds represents net cash proceeds received in connection with all investments, including distributions from investments and disposition proceeds. 6. Remaining Fair Value (“RFV”) is the estimated liquidation values of remaining fund investments that are generally based upon appraisals, contracts and internal estimates. There can be no assurance that Remaining Fair Value will be realized at valuations shown, and realized values will depend on numerous factors including, among others, future asset-level operating results, asset values and market conditions at the time of disposition, transaction costs, and the timing and manner of disposition, all of which may differ from the assumptions on which the Remaining Fair Value are based. Direct fund investments in real property are held at cost minus transaction expenses for the first six months from investment. 33
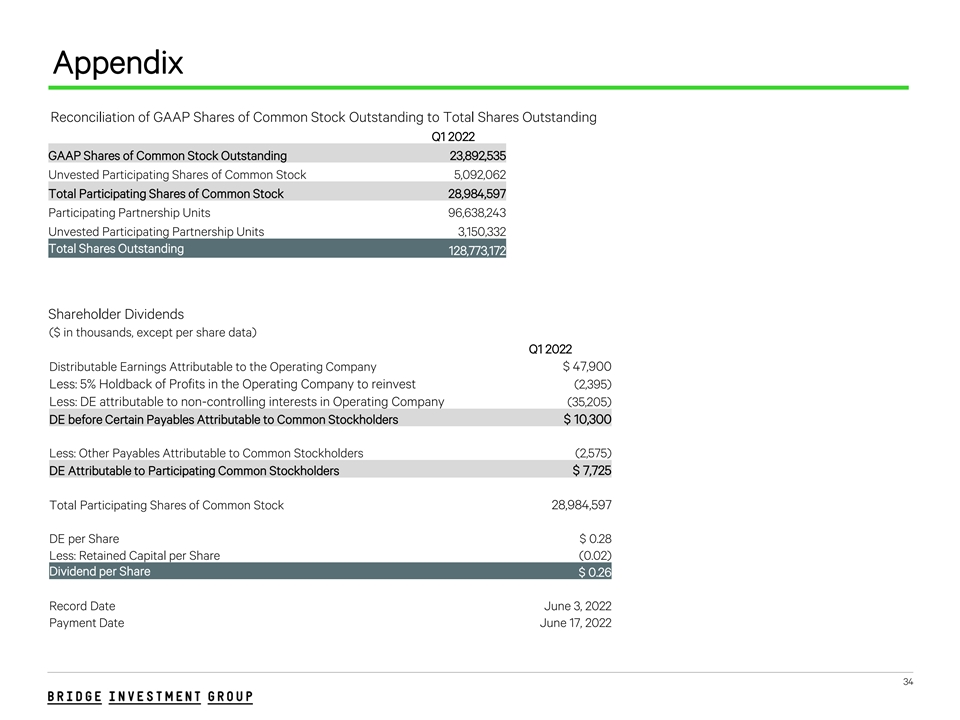
Appendix Reconciliation of GAAP Shares of Common Stock Outstanding to Total Shares Outstanding Q1 2022 GAAP Shares of Common Stock Outstanding 23,892,535 Unvested Participating Shares of Common Stock 5,092,062 Total Participating Shares of Common Stock 28,984,597 Participating Partnership Units 96,638,243 Unvested Participating Partnership Units 3,150,332 Total Shares Outstanding 128,773,172 Shareholder Dividends ($ in thousands, except per share data) Q1 2022 Distributable Earnings Attributable to the Operating Company $ 47,900 Less: 5% Holdback of Profits in the Operating Company to reinvest (2,395) Less: DE attributable to non-controlling interests in Operating Company (35,205) DE before Certain Payables Attributable to Common Stockholders $ 10,300 Less: Other Payables Attributable to Common Stockholders (2,575) DE Attributable to Participating Common Stockholders $ 7,725 Total Participating Shares of Common Stock 28,984,597 DE per Share $ 0.28 Less: Retained Capital per Share (0.02) Dividend per Share $ 0.26 Record Date June 3, 2022 Payment Date June 17, 2022 34
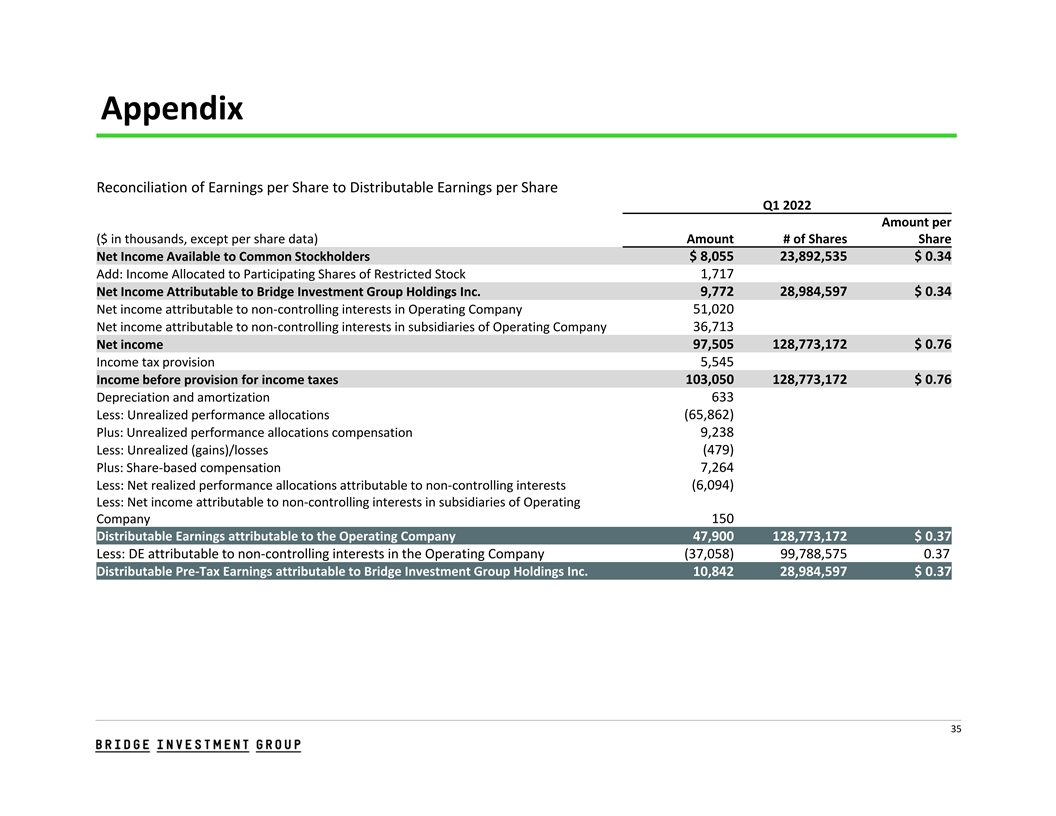
Appendix Reconciliation of Earnings per Share to Distributable Earnings per Share Q1 2022 Amount per ($ in thousands, except per share data) Amount # of Shares Share Net Income Available to Common Stockholders $ 8,055 23,892,535 $ 0.34 Add: Income Allocated to Participating Shares of Restricted Stock 1,717 Net Income Attributable to Bridge Investment Group Holdings Inc. 9,772 28,984,597 $ 0.34 Net income attributable to non‐controlling interests in Operating Company 51,020 Net income attributable to non‐controlling interests in subsidiaries of Operating Company 36,713 Net income 97,505 128,773,172 $ 0.76 Income tax provision 5,545 Income before provision for income taxes 103,050 128,773,172 $ 0.76 Depreciation and amortization 633 Less: Unrealized performance allocations (65,862) Plus: Unrealized performance allocations compensation 9,238 Less: Unrealized (gains)/losses (479) Plus: Share‐based compensation 7,264 Less: Net realized performance allocations attributable to non‐controlling interests (6,094) Less: Net income attributable to non‐controlling interests in subsidiaries of Operating Company 150 Distributable Earnings attributable to the Operating Company 47,900 128,773,172 $ 0.37 Less: DE attributable to non‐controlling interests in the Operating Company (37,058) 99,788,575 0.37 Distributable Pre‐Tax Earnings attributable to Bridge Investment Group Holdings Inc. 10,842 28,984,597 $ 0.37 35
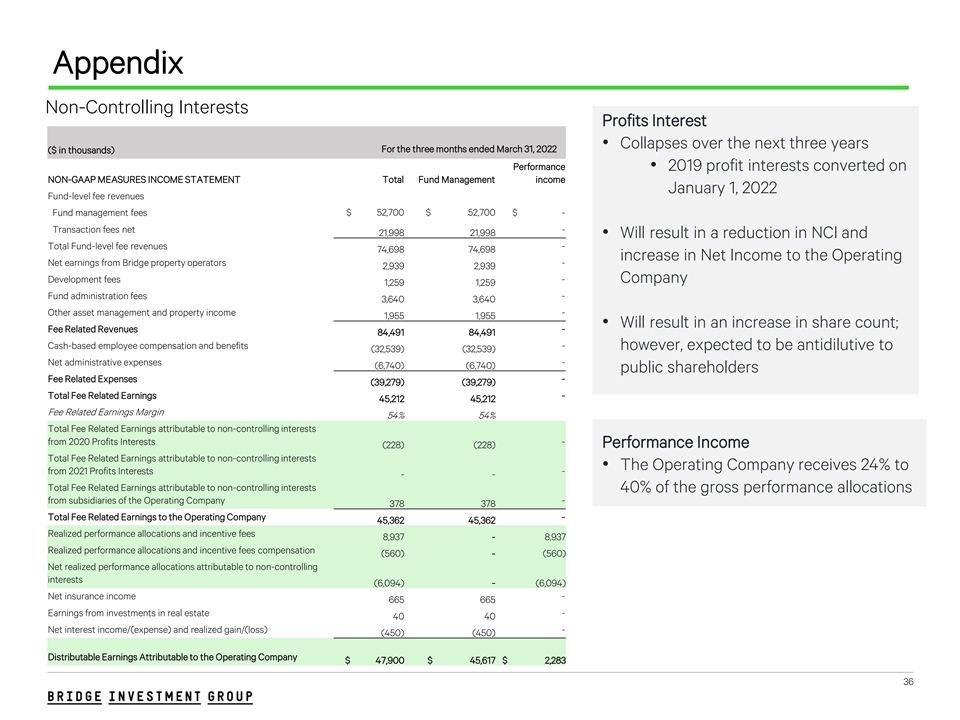
Appendix Non-Controlling Interests Profits Interest • Collapses over the next three years For the three months ended March 31, 2022 ($ in thousands) Performance • 2019 profit interests converted on NON-GAAP MEASURES INCOME STATEMENT Total Fund Management income January 1, 2022 Fund-level fee revenues Fund management fees $ 52,700 $ 52,700 $ - Transaction fees net - 21,998 21,998 • Will result in a reduction in NCI and Total Fund-level fee revenues - 74,698 74,698 increase in Net Income to the Operating Net earnings from Bridge property operators - 2,939 2,939 Development fees - Company 1,259 1,259 Fund administration fees - 3,640 3,640 Other asset management and property income - 1,955 1,955 • Will result in an increase in share count; Fee Related Revenues - 84,491 84,491 Cash-based employee compensation and benefits - however, expected to be antidilutive to (32,539) (32,539) Net administrative expenses - (6,740) (6,740) public shareholders Fee Related Expenses - (39,279) (39,279) Total Fee Related Earnings - 45,212 45,212 Fee Related Earnings Margin 54% 54% Total Fee Related Earnings attributable to non-controlling interests from 2020 Profits Interests - (228) (228) Performance Income Total Fee Related Earnings attributable to non-controlling interests • The Operating Company receives 24% to from 2021 Profits Interests - - - Total Fee Related Earnings attributable to non-controlling interests 40% of the gross performance allocations from subsidiaries of the Operating Company - 378 378 Total Fee Related Earnings to the Operating Company - 45,362 45,362 Realized performance allocations and incentive fees 8,937 - 8,937 Realized performance allocations and incentive fees compensation (560) - (560) Net realized performance allocations attributable to non-controlling interests (6,094) - (6,094) Net insurance income - 665 665 Earnings from investments in real estate - 40 40 Net interest income/(expense) and realized gain/(loss) - (450) (450) Distributable Earnings Attributable to the Operating Company $ 47,900 $ 45,617 $ 2,283 36
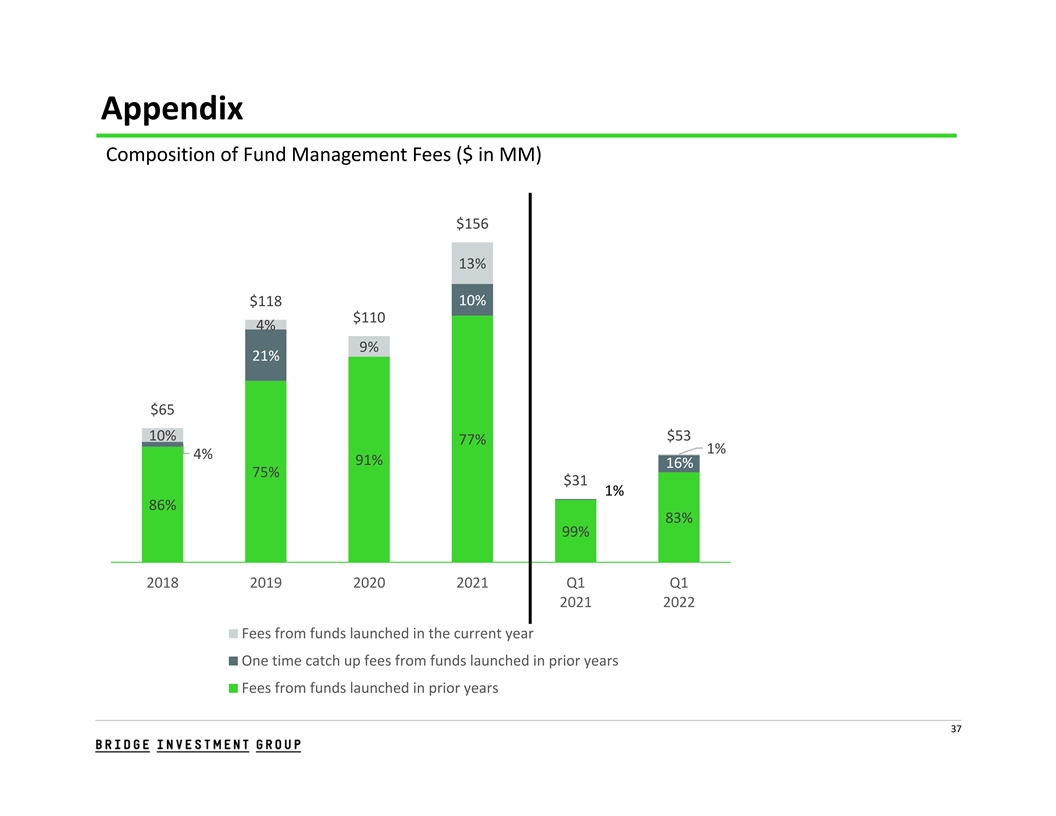
Appendix Composition of Fund Management Fees ($ in MM) $156 13% 10% $118 $110 4% 9% 21% $65 10% $53 77% 1% 4% 91% 16% 75% $31 1% 86% 83% 99% 2018 2019 2020 2021 Q1 Q1 2021 2022 Fees from funds launched in the current year One time catch up fees from funds launched in prior years Fees from funds launched in prior years 37
Glossary Assets under management, or AUM, represents the sum of (a) the fair value of the assets of the funds and vehicles we manage, plus (b) the Assets Under contractual amount of any uncalled capital commitments to those funds and vehicles (including our commitments to the funds and vehicles Management and those of Bridge affiliates). Our AUM is not reduced by any outstanding indebtedness or other accrued but unpaid liabilities of the assets we manage. Our calculations of AUM and fee‐earning AUM may differ from the calculations of other investment managers. As a result, these measures may not be comparable to similar measures presented by other investment managers. In addition, our calculation of AUM includes uncalled commitments to (and the fair value of the assets in) the funds and vehicles we manage from Bridge and Bridge affiliates, regardless of whether such commitments or investments are subject to fees. Our definition of AUM is not based on any definition contained in the agreements governing the funds and vehicles we manage or advise. Distributable Earnings, or DE, is a key performance measure used in our industry and is evaluated regularly by management in making Distributable Earnings resource deployment and compensation decisions, and in assessing our performance. DE differs from net income before provision for income taxes, computed in accordance with U.S. GAAP in that it does not include depreciation and amortization, unrealized performance allocations and related compensation expense, unrealized gains (losses), share‐based compensation, net income attributable to non‐ controlling interests, charges (credits) related to corporate actions and non‐recurring items. Although we believe the inclusion or exclusion of these items provides investors with a meaningful indication of our core operating performance, the use of DE without consideration of the related U.S. GAAP measures is not adequate due to the adjustments described herein. This measure supplements and should be considered in addition to and not in lieu of the results of operations discussed further under “Management’s Discussion and Analysis of Financial Condition and Results of Operations—Key Components of our Results of Operations—Combined Results of Operations” prepared in accordance with U.S. GAAP. Our calculations of DE may differ from the calculations of other investment managers. As a result, these measures may not be comparable to similar measures presented by other investment managers. Fee‐Earning AUM, or FEAUM, reflects the assets from which we earn management fee revenue. The assets we manage that are included in Fee‐Earning AUM our FEAUM typically pay management fees based on capital commitments, invested capital or, in certain cases, NAV, depending on the fee terms. Fee Related Earnings, or FRE, is a supplemental performance measure used to assess our ability of to generate profits from fee‐based Fee Related Earnings revenues that are measured and received on a recurring basis. FRE differs from income before provision for income taxes computed in accordance with U.S. GAAP in that it adjusts for the items included in the calculation of Distributable Earnings, and also adjusts Distributable Earnings to exclude realized performance allocations income, net insurance income, earnings from investments in real estate, net interest (interest income less interest expense), net realized gain/(loss), and, if applicable, certain general and administrative expenses when the timing of any future payment is uncertain. FRE is not a measure of performance calculated in accordance with U.S. GAAP. The use of FRE without consideration of the related U.S. GAAP measures is not adequate due to the adjustments described herein. Our calculations of FRE may differ from the calculations of other investment managers. As a result, these measures may not be comparable to similar measures presented by other investment managers. 38
Glossary (cont’d) Fee Related Expenses is a component of Fee Related Earnings. Fee Related Expenses differs from expenses computed in accordance with Fee Related Expenses U.S. GAAP in that it does not include incentive fee compensation, performance allocations compensation, share‐based compensation, loss and loss adjustment expenses associated with our insurance business, depreciation and amortization, or charges (credits) related to corporate actions and non‐recurring items, and expenses attributable to non‐controlling interest in consolidated entities. Additionally, Fee Related Expenses is reduced by the costs associated with our property operations, which are managed internally in order to enhance returns to the Limited Partners in our funds. Fee Related Expenses are used in management’s review of the business. Please refer to the reconciliation to the comparable line items on the combined statements of operations. Fee Related Revenues is a component of Fee Related Earnings. Fee Related Revenues is comprised of fund management fees, transaction Fee Related Revenues fees net of any third‐party operating expenses, net earnings from Bridge property operators, development fees, and other asset management and property income. Net earnings from Bridge property operators is calculated as a summation of property management, leasing fees and construction management fees less third‐party operating expenses and property operating expenses. Property operating expenses is calculated as a summation of employee compensation and benefits, general and administrative expenses and interest expense at our property operators. We believe our vertical integration enhances returns to our shareholders and fund investors, and we view the net earnings from Bridge property operators as part of our fee related revenue as these services are provided to essentially all of the real estate properties in our equity funds. Net earnings from Bridge property operators is a metric that is included in management’s review of our business. Please refer to the reconciliation to the comparable line items on the combined statements of operations. Fee Related Revenues differs from revenue computed in accordance with U.S. GAAP in that it excludes insurance premiums. Additionally, Fee Related Revenues is reduced by the costs associated with our property operations, which are managed internally in order to enhance returns to the Limited Partners in our funds. Fund management fees refers to fees we earn for advisory services provided to our funds, which are generally based on total commitments, Fund Management Fees invested capital or net asset value managed by us. Fund management fees are generally based on a quarterly measurement period and amounts are paid in advance of recognizing revenue. Bridge Investment Group Holdings LLC, or the Operating Company, acts as a holding company of certain affiliates that provide an array of Operating Company real estate‐related services. The Operating Company is the ultimate controlling entity, through its wholly owned subsidiary Bridge Fund Management Holdings LLC, of the investment manager entities, which we refer to collectively as the Fund Managers. Sponsored Funds refers to the funds, co‐investment vehicles and other entities and accounts that are managed by Bridge, and which are Sponsored Funds structured to pay fees. 39