
Exhibit 99.1
BRIDGE INVESTMENT GROUP HOLDINGS INC. REPORTS THIRD QUARTER 2021 RESULTS
SALT LAKE CITY, UTAH—Bridge Investment Group Holdings Inc. (NYSE: BRDG) (“Bridge” or the “Company”) today reported its financial results for its third quarter ended September 30, 2021.
Total Revenue and Investment Income for Bridge Investment Group Holdings LLC (the “Operating Company”) were $92.2 million and $84.9 million, respectively, for the quarter ended September 30, 2021. These data increased 79% and 340%, respectively, from revenue and investment income figures from the quarter ended September 30, 2020.
Net Income applicable to the Operating Company was $58.0 million for the quarter ended September 30, 2021, compared to $27.2 for the quarter ended September 30, 2020, representing a 113% increase year over year. On a basic and diluted basis, net income attributable to Bridge per share of Class A common stock was $0.41 for the post IPO period from July 16, 2021 through September 30, 2021.
Distributable Earnings of the Operating Company were $42.4 million for the quarter ended September 30, 2021 compared to $14.9 million for the quarter ended September 30, 2020, on a pro forma basis, an increase of $27.5 million or 185%.
Robert Morse, Bridge’s Executive Chairman, commented that, “Bridge delivered another quarter of strong results, based on record capital raising and deployment across our investment verticals. We ended the quarter with record AUM and momentum in the specialized verticals within real estate in which we compete. Our existing strategies continue to attract new capital and our newly launched Logistics strategies are already active in the markets. We continue to see significant growth opportunity for Bridge’s unique investment approach and the information advantage we gain with our forward vertical integration and property management. We are proud that our third quarter results represent new highs for fee-paying AUM, fee-related earnings, and distributable earnings.”
Jonathan Slager, Bridge’s Chief Executive Officer, added “commercial real estate fundamentals continue to be healthy and are recovering in tandem with economic growth. Bridge took advantage of attractive demand over the third quarter to raise a record $1.5 billion of equity commitments and also to deploy a record $1.3 billion of equity in new investments. Bridge also accelerated the pace of investment realizations in the third quarter to take advantage of strong valuations, especially for multifamily assets. With $2.1 billion of dry powder and $302 million of unrealized performance fees, the future looks bright for continued growth in fee revenue.”
Common Dividend
Bridge declared a quarterly dividend of $0.24 per share of its Class A common stock, payable on December 17, 2021, to its Class A common stockholders of record at the close of business on December 3, 2021.
Additional Information
Bridge Investment Group Holdings Inc. issued a full detailed presentation of its third quarter 2021 results, which can be viewed at www.bridgeig.com on the Investors section of our home page. The presentation is titled “Third Quarter 2021 Earnings Presentation.”
Conference Call and Webcast Information
The Company will host a conference call on November 12, 2021 at 8:30 a.m. ET to discuss its third quarter results. Interested parties may access the conference call live over the phone by dialing 1-877-405-1210 (Toll Free) or 1-201-689-8721 (Toll/International) and requesting Bridge Investment Group Holdings Inc.’s Third Quarter 2021 Earnings Conference Call. Participants are asked to dial in a few minutes prior to the call to register for the event. The event will also be available live via webcast which can be accessed here or from our Investor Relations website https://ir.bridgeig.com/.
An audio replay of the conference call will be available approximately three hours after the conference call until 11:59 pm ET on November 26, 2021, and can be accessed by dialing 1-877-660-6853 (domestic) or 1-201-612-7415 (international), and providing the passcode 13724806.
About Bridge Investment Group Holdings Inc.
Bridge is a leading, vertically integrated real estate investment manager, diversified across specialized asset classes, with approximately $31.8 billion of assets under management as of September 30, 2021. Bridge combines its nationwide operating platform with dedicated teams of investment professionals focused on select U.S. real estate verticals: multifamily, affordable housing, seniors housing, office, development, logistics net lease, logistics properties, debt strategies and agency mortgage-backed securities.
Forward-Looking Statements
This earnings release contains certain “forward-looking statements” within the meaning of the Private Securities Litigation Reform Act of 1995, which relate to future events or our future performance or financial condition. All statements other than statements of historical facts may be forward-looking statements. In some cases, you can identify forward-looking statements by terms such as “outlook,” “could,” “believes,” “expects,” “potential,” “opportunity,” “continues,” “may,” “will,” “should,” “over time,” “seeks,” “predicts,” “intends,” “plans,” “estimates,” “anticipates,” “foresees” or negative versions of those words, other comparable words or other statements that do not relate to historical or factual matters. Accordingly, we caution you that any such forward-looking statements are based on our beliefs, assumptions and expectations as of the date made of our future performance, taking into account all information available to us at that time. These statements are not guarantees of future performance, condition or results and involve a number of risks and uncertainties that are difficult to predict and beyond our control. Actual results may differ materially from those express or implied in the forward-looking statements as a result of a number of factors, including but not limited to those risks described from time to time in our filings with the Securities and Exchange Commission. Any forward-looking statement speaks only as of the date on which it is made. Bridge Investment Group Holdings Inc. undertakes no duty to publicly update any forward-looking statements made herein or on the webcast/conference call, whether as a result of new information, future developments or otherwise, except as required by law.
Nothing in this press release constitutes an offer to sell or solicitation of an offer to buy any securities of the Company or any investment fund managed by the Company or its affiliates.
Investor Relations Contact:
Charlotte Morse
Bridge Investment Group Holdings Inc.
(877) 866-4540
rd 3 Quarter Earnings Supplemental NOVEMBER 12, 2021

DISCLAIMER The information contained herein does not constitute or form part of, and should not be construed as, an offer or invitation to subscribe for, underwrite or otherwise acquire, any securities of Bridge Investment Group Holdings Inc. (“Bridge” or the “Company”) or any affiliate of Bridge, or any fund or other investment vehicle managed by Bridge or an affiliate of Bridge. This presentation should not form the basis of, or be relied on in connection with, any contract to purchase or subscribe for any securities of Bridge or any fund or other investment vehicle managed by Bridge or an affiliate of Bridge, or in connection with any other contract or commitment whatsoever. This presentation does not constitute a “prospectus” within the meaning of the Securities Act of 1933, as amended. Any decision to purchase securities of Bridge or any of its affiliates should be made solely on the basis of the information contained in a prospectus to be issued by Bridge in relation to a specific offering. Forward‐Looking Statements This presentation contains forward‐looking statements. All statements other than statements of historical facts contained in this presentation may be forward‐looking statements. Statements regarding our future results of operations and financial position, business strategy and plans and objectives of management for future operations, including, among others, statements regarding expected growth, capital raising, expectations or targets related to financial and non‐financial measures, future capital expenditures, fund performance and debt service obligations, are forward‐looking statements. In some cases, you can identify forward‐looking statements by terms, such as “may,” “will,” “should,” “expects,” “plans,” “seek,” “anticipates,” “plan,” “forecasts,” “outlook,” “could,” “intends,” “targets,” “projects,” “contemplates,” “believes,” “estimates,” “predicts,” “potential” or “continue” or the negative of these terms or other similar expressions. Accordingly, we caution you that any such forward‐looking statements are not guarantees of future performance and are subject to risks, assumptions and uncertainties that are difficult to predict and beyond our ability to control. Although we believe that the expectations reflected in these forward‐looking statements are reasonable as of the date made, actual results may prove to be materially different from the results expressed or implied by the forward‐looking statements. If one or more events related to these forward‐looking statements or other risks or uncertainties materialize, or if our underlying assumptions prove to be incorrect, actual results may differ materially from what we anticipate. Many of the important factors that will determine these results are beyond our ability to control or predict. We believe these factors include but are not limited to those risk factors described under the section entitled “Risk Factors” in our Quarterly Report on Form 10‐ Q filed with the United States Securities and Exchange Commission (the “SEC”) on August 17, 2021 and accessible on the SEC’s website at www.sec.gov. These factors should not be construed as exhaustive and should be read in conjunction with other cautionary statements included in this report and our other filings. Accordingly, you should not place undue reliance on any such forward‐looking statements. Any forward‐looking statement speaks only as of the date on which it is made, and, except as otherwise required by law, we do not undertake any obligation to publicly update or review any forward‐looking statement, whether as a result of new information, future developments or otherwise. New factors emerge from time to time, and it is not possible for us to predict which will arise. We cannot assess the impact of each factor on our business or the extent to which any factor, or combination of factors, may cause actual results to differ materially from those contained in any forward‐looking statements. Industry Information Unless otherwise indicated, information contained in this presentation concerning our industry, competitive position and the markets in which we operate is based on information from independent industry and research organizations, other third‐party sources and management estimates. Management estimates are derived from publicly available information released by independent industry analysts and other third‐party sources, as well as data from our internal research, and are based on assumptions made by us upon reviewing such data, and our experience in, and knowledge of, such industry and markets, which we believe to be reasonable. In addition, projections, assumptions and estimates of the future performance of the industry in which we operate and our future performance are necessarily subject to uncertainty and risk due to a variety of factors, which could cause results to differ materially from those expressed in the estimates made by the independent parties and by us. Non‐GAAP Financial Measures This presentation uses financial measures that are not presented in accordance with generally accepted accounted principles in the United States (“GAAP”), such as Distributable Earnings, Fee Related Earnings, Fee Related Revenues and Performance Related Earnings, to supplement financial information presented in accordance with GAAP. There are limitations to the use of the non‐GAAP financial measures presented in this presentation. For example, the non‐GAAP financial measures may not be comparable to similarly titled measures of other companies. Other companies may calculate non‐GAAP financial measures differently than the Company, limiting the usefulness of those measures for comparative purposes. 2

TODAY’S SPEAKERS ROBERT MORSE JONATHAN SLAGER KATIE ELSNAB Executive Chairman Chief Executive Officer Chief Accounting Officer 3

CHAIRMAN COMMENTARY
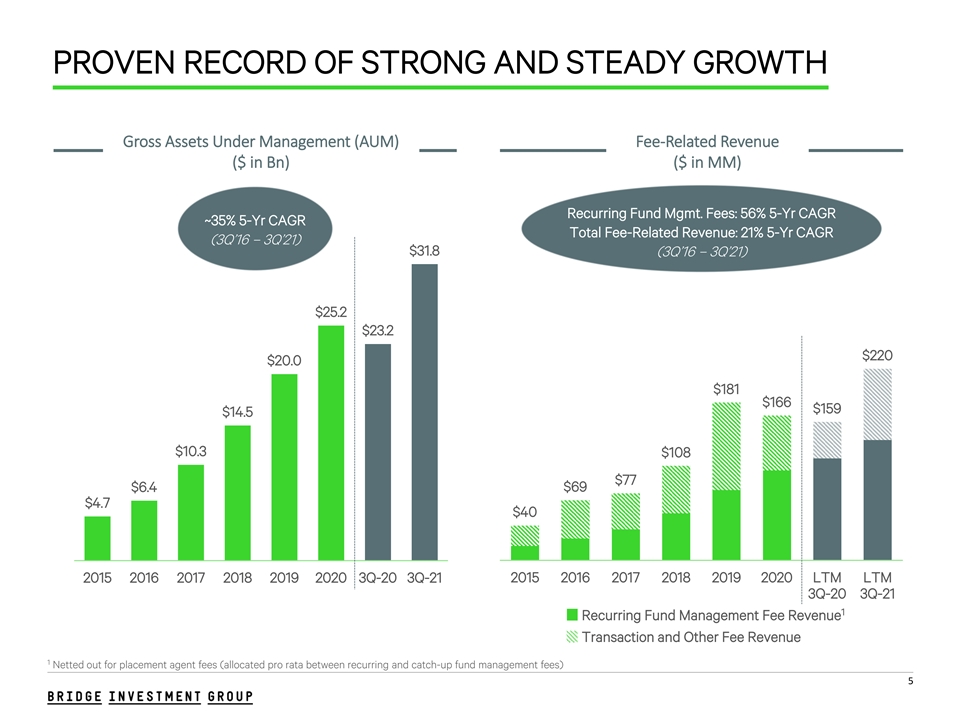
PROVEN RECORD OF STRONG AND STEADY GROWTH Gross Assets Under Management (AUM) Fee-Related Revenue ($ in Bn) ($ in MM) Recurring Fund Mgmt. Fees: 56% 5-Yr CAGR ~35% 5-Yr CAGR Total Fee-Related Revenue: 21% 5-Yr CAGR (3Q’16 – 3Q’21) $31.8 (3Q’16 – 3Q’21) $25.2 $23.2 $220 $20.0 $181 $166 $159 $14.5 $10.3 $108 $77 $6.4 $69 $4.7 $40 2015 2016 2017 2018 2019 2020 3Q-20 3Q-21 2015 2016 2017 2018 2019 2020 LTM LTM 3Q-20 3Q-21 1 Recurring Fund Management Fee Revenue Transaction and Other Fee Revenue 1 Netted out for placement agent fees (allocated pro rata between recurring and catch-up fund management fees) 5
rd 3 QUARTER – EXECUTION HIGHLIGHTS Record Capital Raising rd • $1.5 billion raised in the 3 quarter, a 3Q record and up more than 3x compared to the same period in 2019 • Year-to-date Bridge has raised $2.7 billion and we expect a strong finish to the year in capital raising • 13 new prominent global institutional investors added during the quarter • Bridge’s strategic focus on high-growth CRE sectors drove successful fund closings for Multifamily V, Debt Strategies IV, Agency MBS, Opportunity Zone IV and Logistics Net Lease Record Deployment • $1.3 billion deployed across our strategies, which drove strong FEAUM, management fees and transaction fee growth • $241 million realized at attractive valuations that resulted in $31 million in performance fees th NYSE listing on July 16 2021 • Another milestone in Bridge’s history of growth and performance 6
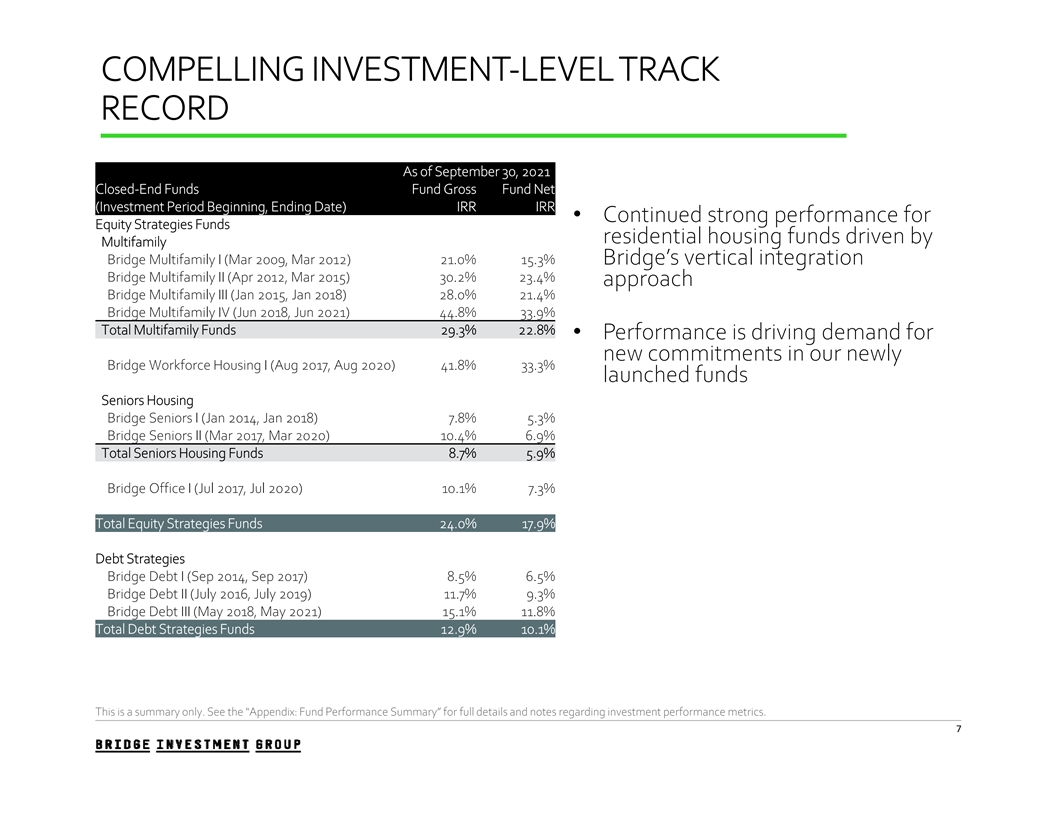
COMPELLING INVESTMENT-LEVEL TRACK RECORD As of September 30, 2021 Closed-End Funds Fund Gross Fund Net (Investment Period Beginning, Ending Date) IRR IRR • Continued strong performance for Equity Strategies Funds residential housing funds driven by Multifamily Bridge Multifamily I (Mar 2009, Mar 2012) 21.0% 15.3% Bridge’s vertical integration Bridge Multifamily II (Apr 2012, Mar 2015) 30.2% 23.4% approach Bridge Multifamily III (Jan 2015, Jan 2018) 28.0% 21.4% Bridge Multifamily IV (Jun 2018, Jun 2021) 44.8% 33.9% Total Multifamily Funds 29.3% 22.8% • Performance is driving demand for new commitments in our newly Bridge Workforce Housing I (Aug 2017, Aug 2020) 41.8% 33.3% launched funds Seniors Housing Bridge Seniors I (Jan 2014, Jan 2018) 7.8% 5.3% Bridge Seniors II (Mar 2017, Mar 2020) 10.4% 6.9% Total Seniors Housing Funds 8.7% 5.9% Bridge Office I (Jul 2017, Jul 2020) 10.1% 7.3% Total Equity Strategies Funds 24.0% 17.9% Debt Strategies Bridge Debt I (Sep 2014, Sep 2017) 8.5% 6.5% Bridge Debt II (July 2016, July 2019) 11.7% 9.3% Bridge Debt III (May 2018, May 2021) 15.1% 11.8% Total Debt Strategies Funds 12.9% 10.1% This is a summary only. See the “Appendix: Fund Performance Summary” for full details and notes regarding investment performancemetrics. 7
BRIDGE INVESTMENT STRATEGY UPDATE Commercial Real Estate Tailwinds • Allocations for commercial real estate investment continue to rise for investors seeking alternative asset exposure and yield 1 • $115.7 billion raised for commercial real estate investment YTD in 2021 • Allocation levels to real estate and other alternatives among pension funds has 2 increased from 6% to 23% over the past 20 years • Commercial real estate fundamentals can hedge inflation risk 3 • Average US multifamily rents up 10.3% over the past twelve months 4 • Average US logistics rents up 7.1% over the past twelve months Strategic Focus on High-Growth Property Sectors • Bridge focuses fundraising and investment in the highest growth property sectors • Undersupply in US residential market is a secular driver for residential assets • Demand shift for logistics assets is expected to be a long-tailed trend • Bridge’s purpose-built, forward vertical integration is a key differentiator 1 PERE, Fundraising Report Q3 2021 2 Willis Towers Watson, Global Pension Assets Study 2020 3 RealPage, as of Q3 2021 4 CoStar Group, as of Q3 2021 8

ESG AND DE&I INITIATIVES ESG continues to be a priority for Bridge as demonstrated by our recent awards for our Workforce and Affordable Housing Strategy 2021 WINNER Best ESG Investment Fund: Private Equity 2021 RUNNER-UP Best ESG Investment Fund: Real Estate/Property Bridge has supported the establishment of multiple employee affinity groups to support our commitment to diversity 9
RD 3 QUARTER SUMMARY HIGHLIGHTS
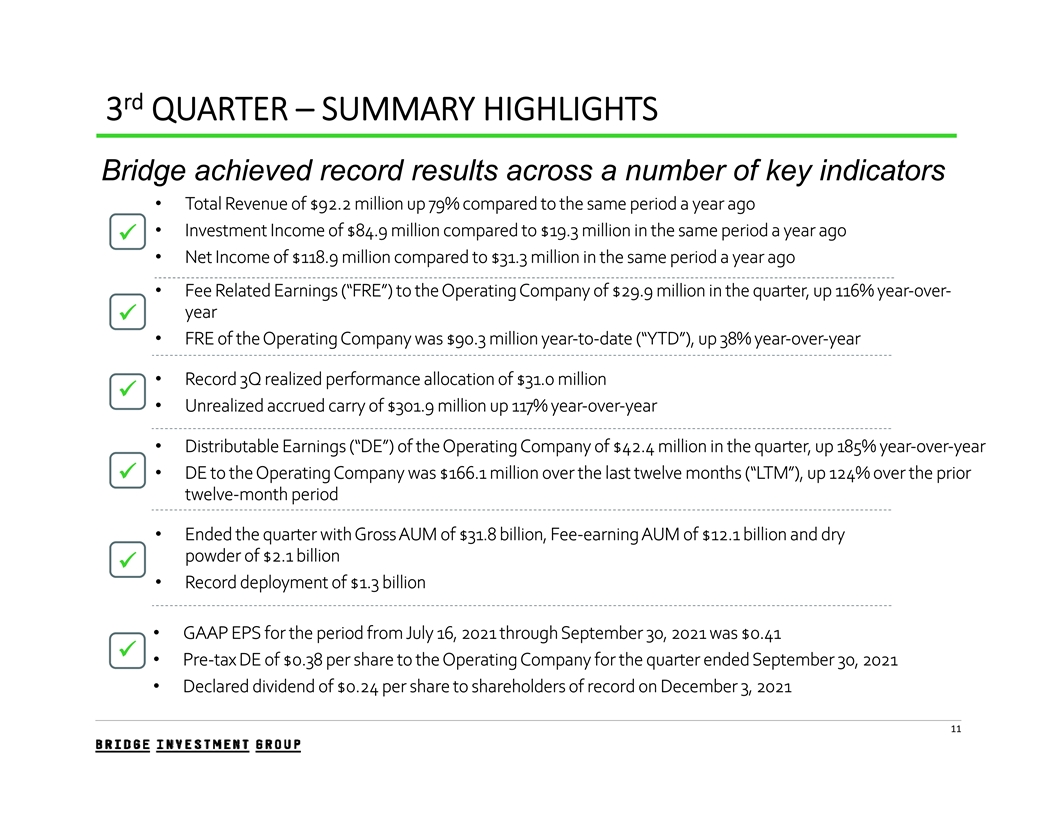
rd 3 QUARTER – SUMMARY HIGHLIGHTS Bridge achieved record results across a number of key indicators • Total Revenue of $92.2 million up 79% compared to the same period a year ago • Investment Income of $84.9 million compared to $19.3 million in the same period a year ago üü • Net Income of $118.9 million compared to $31.3 million in the same period a year ago • Fee Related Earnings (“FRE”) to the Operating Company of $29.9 million in the quarter, up 116% year-over- year üü • FRE of the Operating Company was $90.3 million year-to-date (“YTD”), up 38% year-over-year • Record 3Q realized performance allocation of $31.0 million üü • Unrealized accrued carry of $301.9 million up 117% year-over-year • Distributable Earnings (“DE”) of the Operating Company of $42.4 million in the quarter, up 185% year-over-year • DE to the Operating Company was $166.1 million over the last twelve months (“LTM”), up 124% over the prior üü twelve-month period • Ended the quarter with Gross AUM of $31.8 billion, Fee-earning AUM of $12.1 billion and dry powder of $2.1 billion üü • Record deployment of $1.3 billion • GAAP EPS for the period from July 16, 2021 through September 30, 2021 was $0.41 üü • Pre-tax DE of $0.38 per share to the Operating Company for the quarter ended September 30, 2021 • Declared dividend of $0.24 per share to shareholders of record on December 3, 2021 11
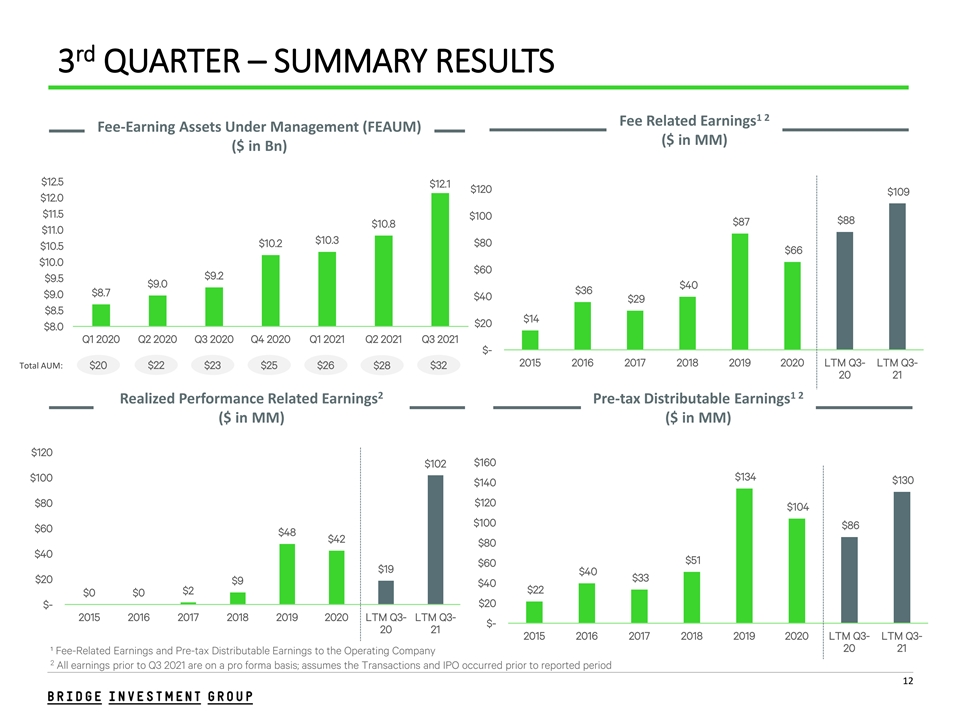
rd 3 QUARTER – SUMMARY RESULTS 1 2 Fee Related Earnings Fee-Earning Assets Under Management (FEAUM) ($ in MM) ($ in Bn) $12.5 $12.1 $120 $109 $12.0 $11.5 $100 $88 $87 $10.8 $11.0 $10.3 $10.2 $80 $10.5 $66 $10.0 $60 $9.2 $9.5 $9.0 $40 $36 $8.7 $9.0 $40 $29 $8.5 $14 $20 $8.0 Q1 2020 Q2 2020 Q3 2020 Q4 2020 Q1 2021 Q2 2021 Q3 2021 $- 2015 2016 2017 2018 2019 2020 LTM Q3- LTM Q3- Total AUM: $20 $22 $23 $25 $26 $28 $32 20 21 2 1 2 Realized Performance Related Earnings Pre-tax Distributable Earnings ($ in MM) ($ in MM) $120 $160 $102 $134 $100 $130 $140 $80 $120 $104 $100 $86 $60 $48 $42 $80 $40 $51 $60 $19 $40 $33 $20 $9 $40 $22 $2 $0 $0 $20 $- 2015 2016 2017 2018 2019 2020 LTM Q3- LTM Q3- $- 20 21 2015 2016 2017 2018 2019 2020 LTM Q3- LTM Q3- 20 21 ¹ Fee-Related Earnings and Pre-tax Distributable Earnings to the Operating Company 2 All earnings prior to Q3 2021 are on a pro forma basis; assumes the Transactions and IPO occurred prior to reported period 12
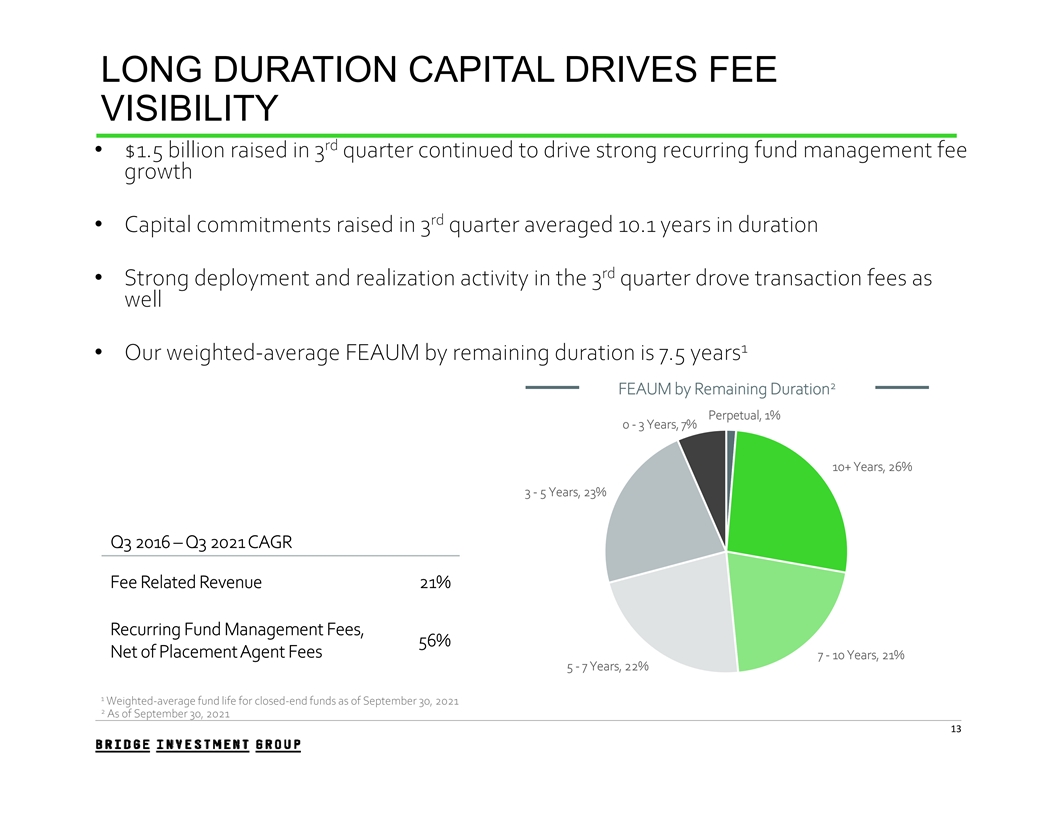
LONG DURATION CAPITAL DRIVES FEE VISIBILITY rd • $1.5 billion raised in 3 quarter continued to drive strong recurring fund management fee growth rd • Capital commitments raised in 3 quarter averaged 10.1 years in duration rd • Strong deployment and realization activity in the 3 quarter drove transaction fees as well 1 • Our weighted-average FEAUM by remaining duration is 7.5 years 2 FEAUM by Remaining Duration Perpetual, 1% 0 - 3 Years, 7% 10+ Years, 26% 3 - 5 Years, 23% Q3 2016 – Q3 2021 CAGR Fee Related Revenue 21% Recurring Fund Management Fees, 56% Net of Placement Agent Fees 7 - 10 Years, 21% 5 - 7 Years, 22% 1 Weighted-average fund life for closed-end funds as of September 30, 2021 2 As of September 30, 2021 13
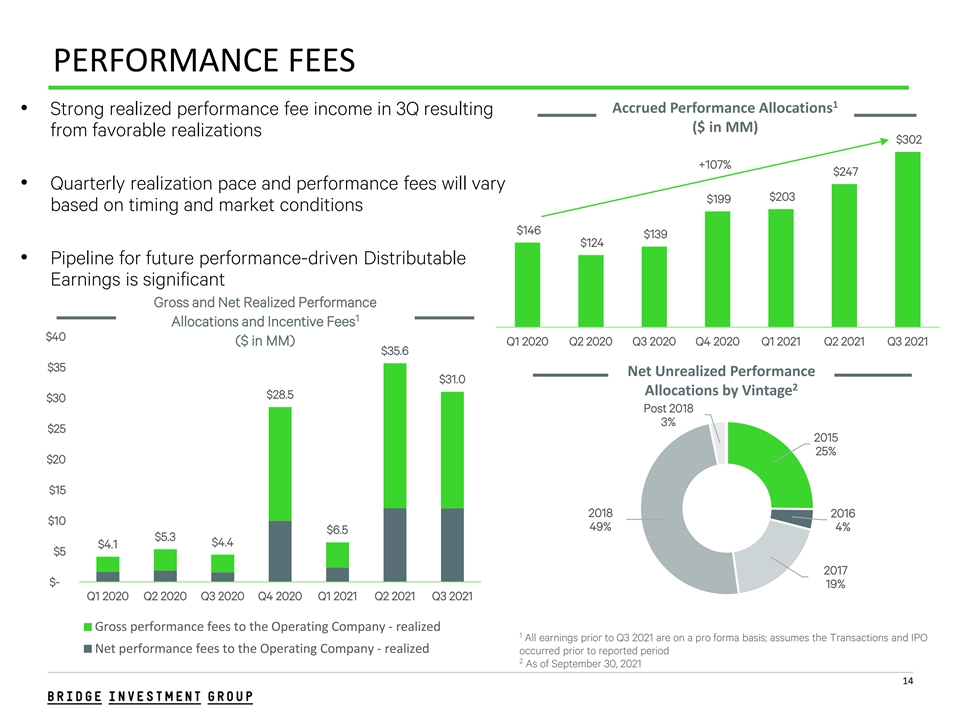
PERFORMANCE FEES 1 Accrued Performance Allocations • Strong realized performance fee income in 3Q resulting ($ in MM) from favorable realizations $302 +107% $247 • Quarterly realization pace and performance fees will vary $203 $199 based on timing and market conditions $146 $139 $124 • Pipeline for future performance-driven Distributable Earnings is significant Gross and Net Realized Performance 1 Allocations and Incentive Fees $40 ($ in MM) Q1 2020 Q2 2020 Q3 2020 Q4 2020 Q1 2021 Q2 2021 Q3 2021 $35.6 $35 Net Unrealized Performance $31.0 2 Allocations by Vintage $28.5 $30 Post 2018 3% $25 2015 25% $20 $15 2018 2016 $10 49% 4% $6.5 $5.3 $4.4 $4.1 $5 2017 $- 19% Q1 2020 Q2 2020 Q3 2020 Q4 2020 Q1 2021 Q2 2021 Q3 2021 Gross performance fees to the Operating Company - realized 1 All earnings prior to Q3 2021 are on a pro forma basis; assumes the Transactions and IPO Net performance fees to the Operating Company - realized occurred prior to reported period 2 As of September 30, 2021 14
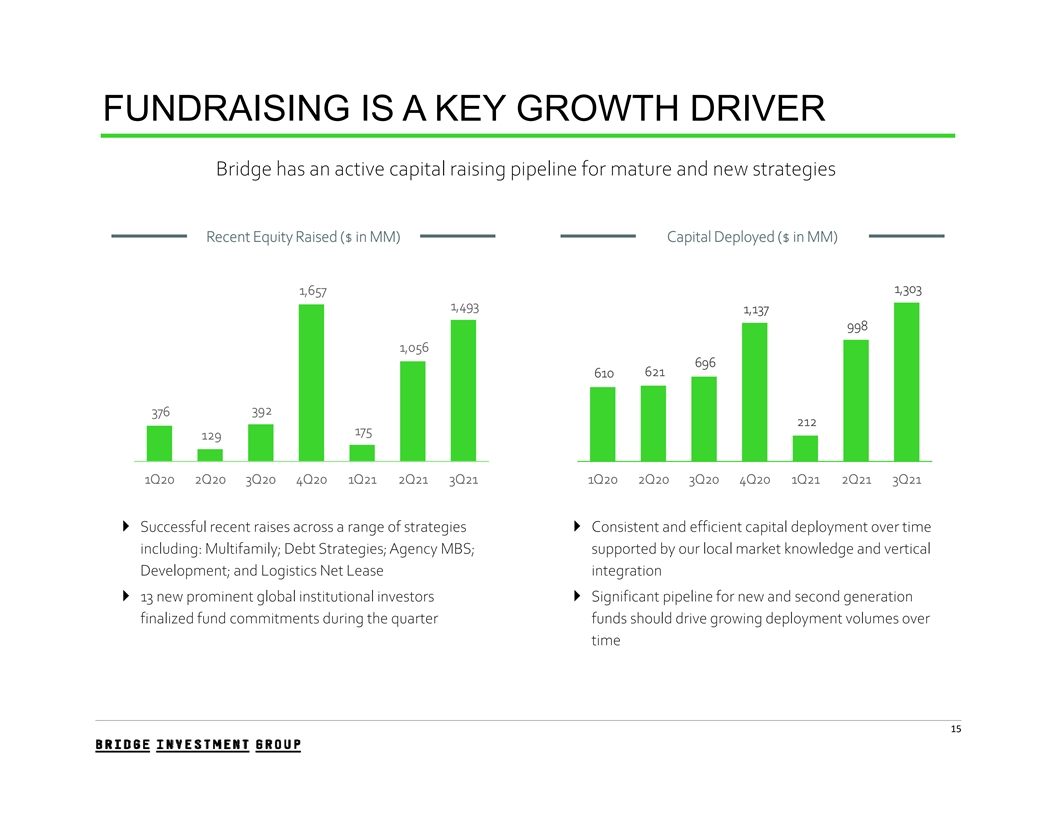
FUNDRAISING IS A KEY GROWTH DRIVER Bridge has an active capital raising pipeline for mature and new strategies Recent Equity Raised ($ in MM) Capital Deployed ($ in MM) 1,303 1,657 1,493 1,137 998 1,056 696 621 610 392 376 212 175 129 1Q20 2Q20 3Q20 4Q20 1Q21 2Q21 3Q21 1Q20 2Q20 3Q20 4Q20 1Q21 2Q21 3Q21 4 Successful recent raises across a range of strategies 4 Consistent and efficient capital deployment over time including: Multifamily; Debt Strategies; Agency MBS; supported by our local market knowledge and vertical Development; and Logistics Net Lease integration 4 13 new prominent global institutional investors 4 Significant pipeline for new and second generation finalized fund commitments during the quarter funds should drive growing deployment volumes over time 15

RD 3 QUARTER FINANCIAL REVIEW
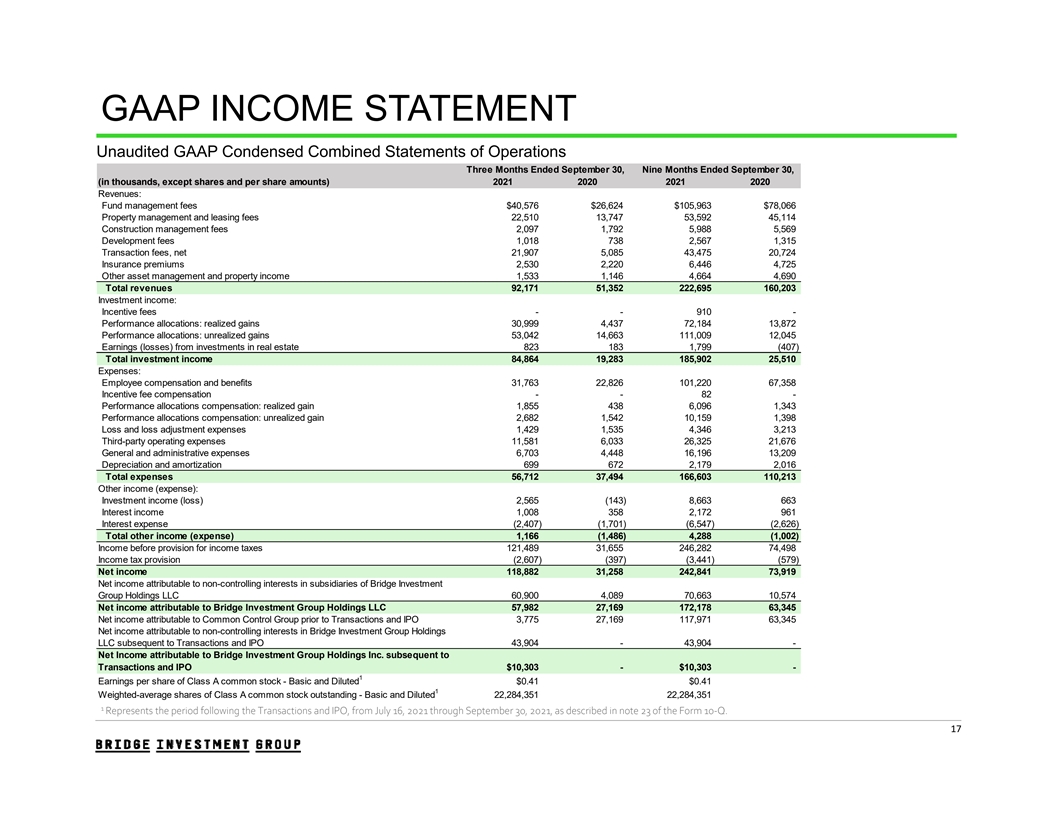
GAAP INCOME STATEMENT Unaudited GAAP Condensed Combined Statements of Operations Three Months Ended September 30, Nine Months Ended September 30, (in thousands, except shares and per share amounts) 2021 2020 2021 2020 Revenues: Fund management fees $40,576 $26,624 $105,963 $78,066 Property management and leasing fees 22,510 13,747 53,592 45,114 Construction management fees 2,097 1,792 5,988 5,569 Development fees 1,018 738 2,567 1,315 Transaction fees, net 21,907 5,085 43,475 20,724 Insurance premiums 2,530 2,220 6,446 4,725 Other asset management and property income 1,533 1,146 4,664 4,690 Total revenues 92,171 51,352 222,695 160,203 Investment income: Incentive fees - - 910 - Performance allocations: realized gains 30,999 4,437 72,184 13,872 Performance allocations: unrealized gains 53,042 14,663 111,009 12,045 Earnings (losses) from investments in real estate 823 183 1,799 (407) Total investment income 84,864 19,283 185,902 25,510 Expenses: Employee compensation and benefits 31,763 22,826 101,220 67,358 Incentive fee compensation - - 82 - Performance allocations compensation: realized gain 1,855 438 6,096 1,343 Performance allocations compensation: unrealized gain 2,682 1,542 10,159 1,398 Loss and loss adjustment expenses 1,429 1,535 4,346 3,213 Third-party operating expenses 11,581 6,033 26,325 21,676 General and administrative expenses 6,703 4,448 16,196 13,209 Depreciation and amortization 699 672 2,179 2,016 Total expenses 56,712 37,494 166,603 110,213 Other income (expense): Investment income (loss) 2,565 (143) 8,663 663 Interest income 1,008 358 2,172 961 Interest expense (2,407) (1,701) (6,547) (2,626) Total other income (expense) 1,166 (1,486) 4,288 (1,002) Income before provision for income taxes 121,489 31,655 246,282 74,498 Income tax provision (2,607) (397) (3,441) (579) Net income 118,882 31,258 242,841 73,919 Net income attributable to non-controlling interests in subsidiaries of Bridge Investment Group Holdings LLC 60,900 4,089 70,663 10,574 Net income attributable to Bridge Investment Group Holdings LLC 57,982 27,169 172,178 63,345 Net income attributable to Common Control Group prior to Transactions and IPO 3,775 27,169 117,971 63,345 Net income attributable to non-controlling interests in Bridge Investment Group Holdings LLC subsequent to Transactions and IPO 43,904 - 43,904 - Net Income attributable to Bridge Investment Group Holdings Inc. subsequent to Transactions and IPO $10,303 - $10,303 - 1 Earnings per share of Class A common stock - Basic and Diluted $0.41 $0.41 1 Weighted-average shares of Class A common stock outstanding - Basic and Diluted 22,284,351 22,284,351 1 Represents the period following the Transactions and IPO, from July 16, 2021 through September 30, 2021, as described in note 23 of the Form 10-Q. 17
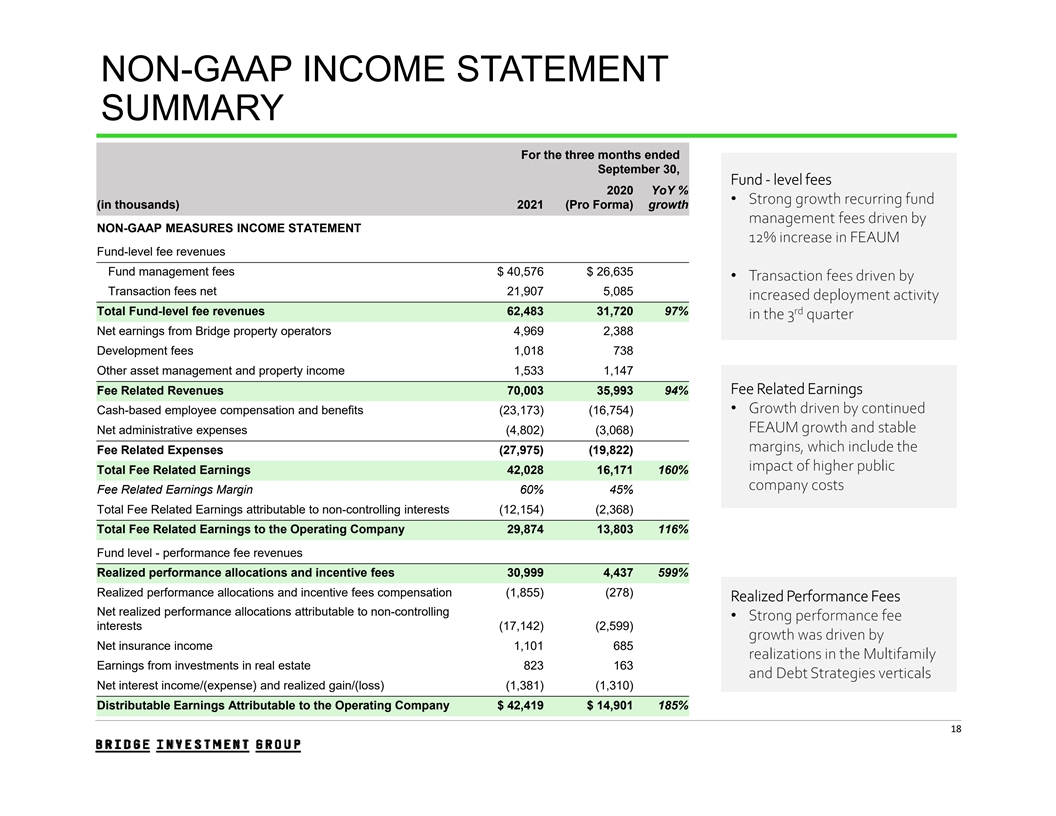
NON-GAAP INCOME STATEMENT SUMMARY For the three months ended September 30, Fund - level fees 2020 YoY % • Strong growth recurring fund (in thousands) 2021 (Pro Forma) growth management fees driven by NON-GAAP MEASURES INCOME STATEMENT 12% increase in FEAUM Fund-level fee revenues Fund management fees $ 40,576 $ 26,635 • Transaction fees driven by Transaction fees net 21,907 5,085 increased deployment activity rd Total Fund-level fee revenues 62,483 31,720 97% in the 3 quarter Net earnings from Bridge property operators 4,969 2,388 Development fees 1,018 738 Other asset management and property income 1,533 1,147 Fee Related Revenues 70,003 35,993 94% Fee Related Earnings • Growth driven by continued Cash-based employee compensation and benefits (23,173) (16,754) FEAUM growth and stable Net administrative expenses (4,802) (3,068) margins, which include the Fee Related Expenses (27,975) (19,822) impact of higher public Total Fee Related Earnings 42,028 16,171 160% company costs Fee Related Earnings Margin 60% 45% Total Fee Related Earnings attributable to non-controlling interests (12,154) (2,368) Total Fee Related Earnings to the Operating Company 29,874 13,803 116% Fund level - performance fee revenues Realized performance allocations and incentive fees 30,999 4,437 599% Realized performance allocations and incentive fees compensation (1,855) (278) Realized Performance Fees Net realized performance allocations attributable to non-controlling • Strong performance fee interests (17,142) (2,599) growth was driven by Net insurance income 1,101 685 realizations in the Multifamily Earnings from investments in real estate 823 163 and Debt Strategies verticals Net interest income/(expense) and realized gain/(loss) (1,381) (1,310) Distributable Earnings Attributable to the Operating Company $ 42,419 $ 14,901 185% 18
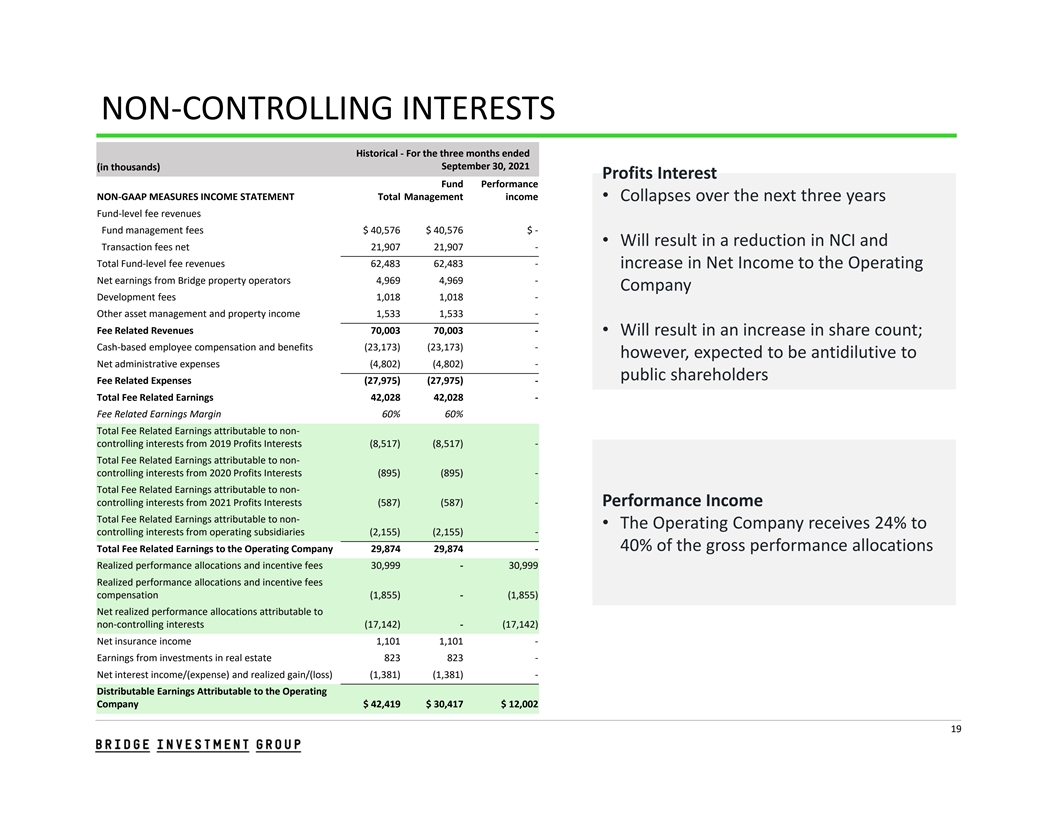
NON‐CONTROLLING INTERESTS Historical ‐ For the three months ended September 30, 2021 (in thousands) Profits Interest Fund Performance NON‐GAAP MEASURES INCOME STATEMENT Total Management income • Collapses over the next three years Fund‐level fee revenues Fund management fees $ 40,576 $ 40,576 $ ‐ • Will result in a reduction in NCI and Transaction fees net 21,907 21,907 ‐ Total Fund‐level fee revenues 62,483 62,483 ‐ increase in Net Income to the Operating Net earnings from Bridge property operators 4,969 4,969 ‐ Company Development fees 1,018 1,018 ‐ Other asset management and property income 1,533 1,533 ‐ Fee Related Revenues 70,003 70,003 ‐ • Will result in an increase in share count; Cash‐based employee compensation and benefits (23,173) (23,173) ‐ however, expected to be antidilutive to Net administrative expenses (4,802) (4,802) ‐ public shareholders Fee Related Expenses (27,975) (27,975) ‐ Total Fee Related Earnings 42,028 42,028 ‐ Fee Related Earnings Margin 60% 60% Total Fee Related Earnings attributable to non‐ controlling interests from 2019 Profits Interests (8,517) (8,517) ‐ Total Fee Related Earnings attributable to non‐ controlling interests from 2020 Profits Interests (895) (895) ‐ Total Fee Related Earnings attributable to non‐ controlling interests from 2021 Profits Interests (587) (587) ‐ Performance Income Total Fee Related Earnings attributable to non‐ • The Operating Company receives 24% to controlling interests from operating subsidiaries (2,155) (2,155) ‐ 40% of the gross performance allocations Total Fee Related Earnings to the Operating Company 29,874 29,874 ‐ Realized performance allocations and incentive fees 30,999 ‐ 30,999 Realized performance allocations and incentive fees compensation (1,855) ‐ (1,855) Net realized performance allocations attributable to non‐controlling interests (17,142) ‐ (17,142) Net insurance income 1,101 1,101 ‐ Earnings from investments in real estate 823 823 ‐ Net interest income/(expense) and realized gain/(loss) (1,381) (1,381) ‐ Distributable Earnings Attributable to the Operating Company $ 42,419 $ 30,417 $ 12,002 19
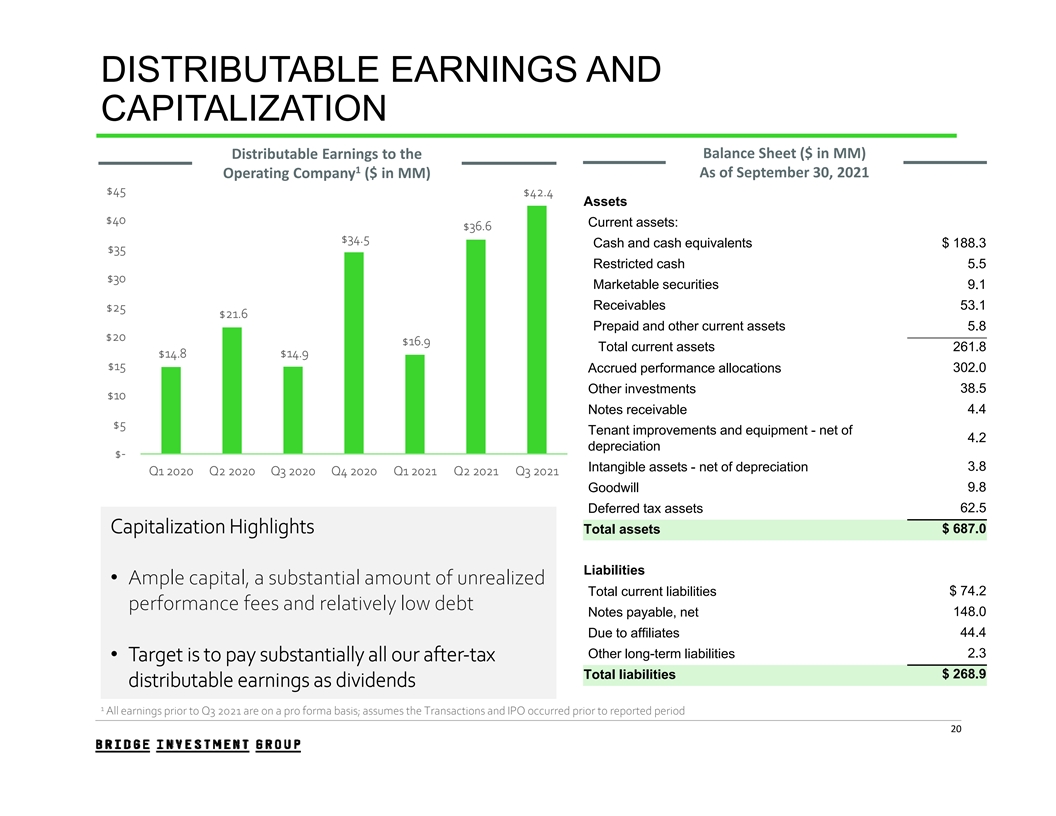
DISTRIBUTABLE EARNINGS AND CAPITALIZATION Distributable Earnings to the Balance Sheet ($ in MM) 1 As of September 30, 2021 Operating Company ($ in MM) $45 $42.4 Assets $40 Current assets: $36.6 $34.5 Cash and cash equivalents $ 188.3 $35 Restricted cash 5.5 $30 Marketable securities 9.1 Receivables 53.1 $25 $21.6 Prepaid and other current assets 5.8 $20 $16.9 Total current assets 261.8 $14.8 $14.9 $15 302.0 Accrued performance allocations Other investments 38.5 $10 4.4 Notes receivable $5 Tenant improvements and equipment - net of 4.2 depreciation $- 3.8 Intangible assets - net of depreciation Q1 2020 Q2 2020 Q3 2020 Q4 2020 Q1 2021 Q2 2021 Q3 2021 Goodwill 9.8 62.5 Deferred tax assets Capitalization Highlights Total assets $ 687.0 Liabilities • Ample capital, a substantial amount of unrealized Total current liabilities $ 74.2 performance fees and relatively low debt 148.0 Notes payable, net Due to affiliates 44.4 2.3 Other long-term liabilities • Target is to pay substantially all our after-tax Total liabilities $ 268.9 distributable earnings as dividends 1 All earnings prior to Q3 2021 are on a pro forma basis; assumes the Transactions and IPO occurred prior to reported period 20
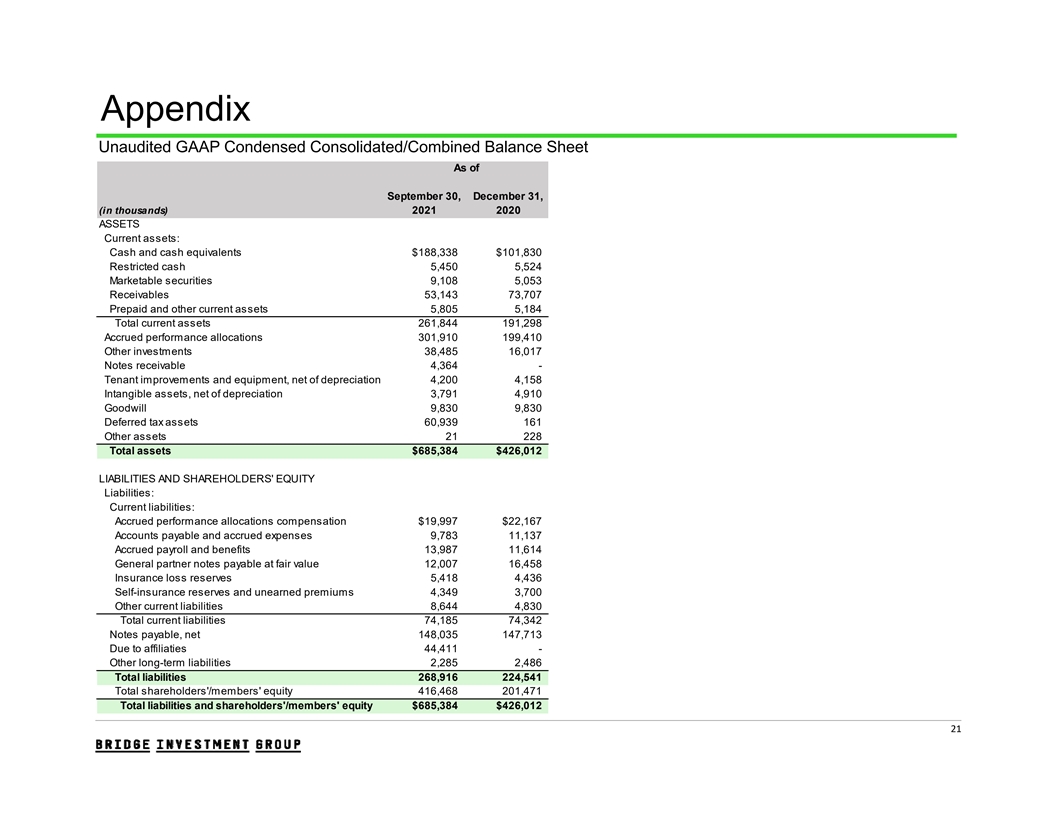
Appendix Unaudited GAAP Condensed Consolidated/Combined Balance Sheet As of September 30, December 31, (in thousands) 2021 2020 ASSETS Current assets: Cash and cash equivalents $188,338 $101,830 Restricted cash 5,450 5,524 Marketable securities 9,108 5,053 Receivables 53,143 73,707 Prepaid and other current assets 5,805 5,184 Total current assets 261,844 191,298 Accrued performance allocations 301,910 199,410 Other investments 38,485 16,017 Notes receivable 4,364 - Tenant improvements and equipment, net of depreciation 4,200 4,158 Intangible assets, net of depreciation 3,791 4,910 Goodwill 9,830 9,830 Deferred tax assets 60,939 161 Other assets 21 228 Total assets $685,384 $426,012 LIABILITIES AND SHAREHOLDERS' EQUITY Liabilities: Current liabilities: Accrued performance allocations compensation $19,997 $22,167 Accounts payable and accrued expenses 9,783 11,137 Accrued payroll and benefits 13,987 11,614 General partner notes payable at fair value 12,007 16,458 Insurance loss reserves 5,418 4,436 Self-insurance reserves and unearned premiums 4,349 3,700 Other current liabilities 8,644 4,830 Total current liabilities 74,185 74,342 Notes payable, net 148,035 147,713 Due to affiliaties 44,411 - Other long-term liabilities 2,285 2,486 Total liabilities 268,916 224,541 Total shareholders'/members' equity 416,468 201,471 Total liabilities and shareholders'/members' equity $685,384 $426,012 21
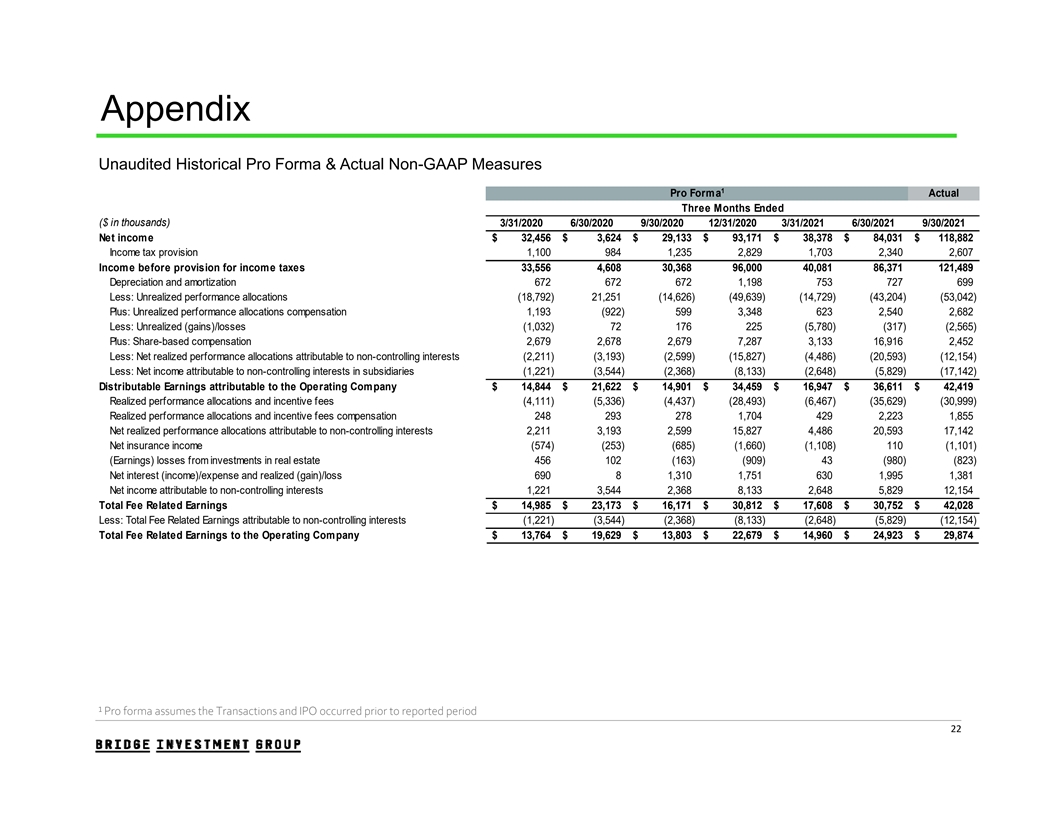
Appendix Unaudited Historical Pro Forma & Actual Non-GAAP Measures 1 Pro Forma Actual Three Months Ended ($ in thousands) 3/31/2020 6/30/2020 9/30/2020 12/31/2020 3/31/2021 6/30/2021 9/30/2021 Net incom e $ 32,456 $ 3,624 $ 29,133 $ 93,171 $ 38,378 $ 84,031 $ 1 18,882 Income tax provision 1,100 984 1,235 2,829 1,703 2,340 2,607 Income before provision for income taxes 33,556 4,608 30,368 96,000 40,081 86,371 1 21,489 Depreciation and amortization 672 672 672 1,198 753 727 699 Less: Unrealized performance allocations (18,792) 21,251 (14,626) (49,639) (14,729) (43,204) (53,042) Plus: Unrealized performance allocations compensation 1,193 (922) 599 3,348 623 2,540 2,682 Less: Unrealized (gains)/losses (1,032) 72 176 225 (5,780) (317) (2,565) Plus: Share-based compensation 2,679 2,678 2,679 7,287 3,133 16,916 2,452 Less: Net realized performance allocations attributable to non-controlling interests (2,211) (3,193) (2,599) (15,827) (4,486) (20,593) (12,154) Less: Net income attributable to non-controlling interests in subsidiaries (1,221) (3,544) (2,368) (8,133) (2,648) (5,829) (17,142) Distributable Earnings attributable to the Operating Company $ 14,844 $ 21,622 $ 14,901 $ 34,459 $ 16,947 $ 36,611 $ 42,419 Realized performance allocations and incentive fees (4,111) (5,336) (4,437) (28,493) (6,467) (35,629) (30,999) Realized performance allocations and incentive fees compensation 248 293 278 1,704 429 2,223 1,855 Net realized performance allocations attributable to non-controlling interests 2,211 3,193 2,599 15,827 4,486 20,593 17,142 Net insurance income (574) (253) (685) (1,660) (1,108) 110 (1,101) (Earnings) losses from investments in real estate 456 102 (163) (909) 43 (980) (823) Net interest (income)/expense and realized (gain)/loss 690 8 1,310 1,751 630 1,995 1,381 Net income attributable to non-controlling interests 1,221 3,544 2,368 8,133 2,648 5,829 12,154 Total Fee Related Earnings $ 14,985 $ 23,173 $ 16,171 $ 30,812 $ 17,608 $ 30,752 $ 42,028 Less: Total Fee Related Earnings attributable to non-controlling interests (1,221) (3,544) (2,368) (8,133) (2,648) (5,829) (12,154) Total Fee Related Earnings to the Operating Company $ 13,764 $ 19,629 $ 13,803 $ 22,679 $ 14,960 $ 24,923 $ 29,874 ¹ Pro forma assumes the Transactions and IPO occurred prior to reported period 22
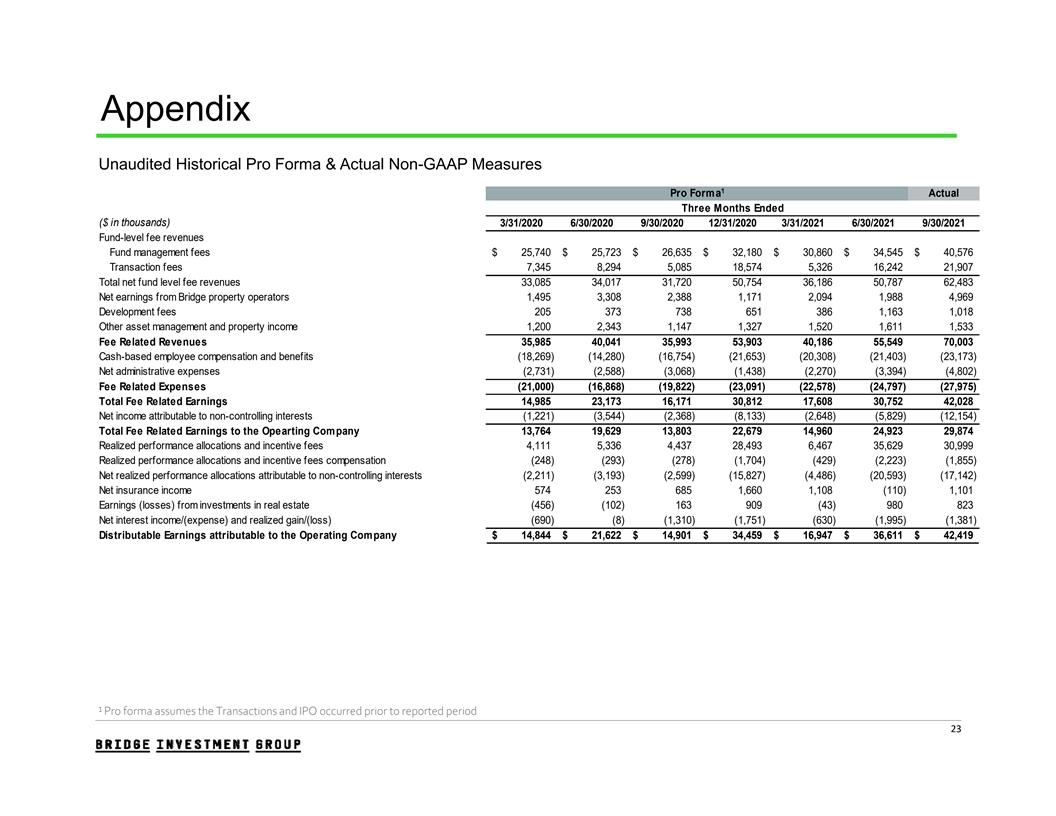
Appendix Unaudited Historical Pro Forma & Actual Non-GAAP Measures 1 Pro Forma Actual Three Months Ended ($ in thousands) 3/31/2020 6/30/2020 9/30/2020 12/31/2020 3/31/2021 6/30/2021 9/30/2021 Fund-level fee revenues Fund management fees $ 25,740 $ 25,723 $ 26,635 $ 32,180 $ 30,860 $ 34,545 $ 40,576 Transaction fees 7,345 8,294 5,085 18,574 5,326 16,242 21,907 Total net fund level fee revenues 33,085 34,017 31,720 50,754 36,186 50,787 62,483 Net earnings from Bridge property operators 1,495 3,308 2,388 1,171 2,094 1,988 4,969 Development fees 205 373 738 651 386 1,163 1,018 Other asset management and property income 1,200 2,343 1,147 1,327 1,520 1,611 1,533 Fee Related Revenues 35,985 40,041 35,993 53,903 40,186 55,549 70,003 Cash-based employee compensation and benefits (18,269) (14,280) (16,754) (21,653) (20,308) (21,403) (23,173) Net administrative expenses (2,731) (2,588) (3,068) (1,438) (2,270) (3,394) (4,802) Fee Related Expenses (21,000) (16,868) (19,822) (23,091) (22,578) (24,797) (27,975) Total Fee Related Earnings 14,985 23,173 16,171 30,812 17,608 30,752 42,028 Net income attributable to non-controlling interests (1,221) (3,544) (2,368) (8,133) (2,648) (5,829) (12,154) Total Fee Related Earnings to the Opearting Company 13,764 19,629 13,803 22,679 14,960 24,923 29,874 Realized performance allocations and incentive fees 4,111 5,336 4,437 28,493 6,467 35,629 30,999 Realized performance allocations and incentive fees compensation (248) (293) (278) (1,704) (429) (2,223) (1,855) Net realized performance allocations attributable to non-controlling interests (2,211) (3,193) (2,599) (15,827) (4,486) (20,593) (17,142) Net insurance income 574 253 685 1,660 1,108 (110) 1,101 Earnings (losses) from investments in real estate (456) (102) 163 909 (43) 980 823 Net interest income/(expense) and realized gain/(loss) (690) (8) (1,310) (1,751) (630) (1,995) (1,381) Distributable Earnings attributable to the Operating Company $ 14,844 $ 21,622 $ 14,901 $ 34,459 $ 16,947 $ 36,611 $ 42,419 ¹ Pro forma assumes the Transactions and IPO occurred prior to reported period 23
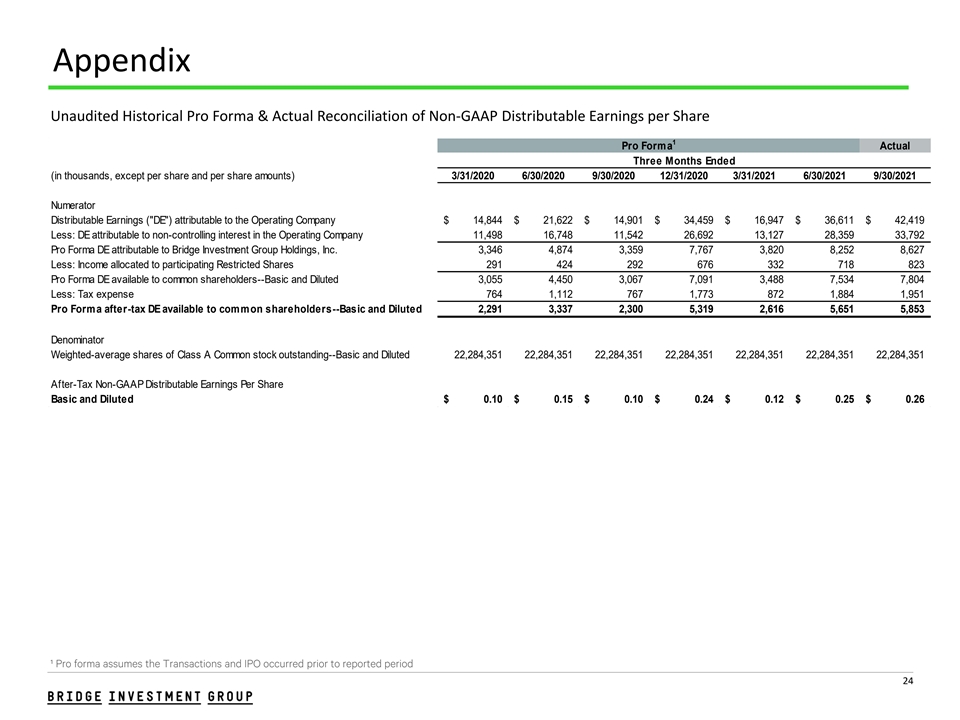
Appendix Unaudited Historical Pro Forma & Actual Reconciliation of Non-GAAP Distributable Earnings per Share 1 Pro Forma Actual Three Months Ended (in thousands, except per share and per share amounts) 3/31/2020 6/30/2020 9/30/2020 12/31/2020 3/31/2021 6/30/2021 9/30/2021 Numerator Distributable Earnings ( DE ) attributable to the Operating Company $ 14, 844 $ 21, 622 $ 14, 901 $ 34, 459 $ 16, 947 $ 36, 611 $ 42, 419 Less: DE attributable to non-controlling interest in the Operating Company 11, 498 16, 748 11, 542 26, 692 13, 127 28, 359 33, 792 Pro Forma DE attributable to Bridge Investment Group Holdings, Inc. 3, 346 4, 874 3, 359 7, 767 3, 820 8, 252 8, 627 Less: Income allocated to participating Restricted Shares 291 424 292 676 332 718 823 Pro Forma DE available to common shareholders--Basic and Diluted 3, 055 4, 450 3, 067 7, 091 3, 488 7, 534 7, 804 Less: Tax expense 764 1, 112 767 1, 773 872 1, 884 1, 951 Pro Forma after-tax DE available to common shareholders--Basic and Diluted 2, 291 3, 337 2, 300 5, 319 2, 616 5, 651 5, 853 Denominator Weighted-average shares of Class A Common stock outstanding--Basic and Diluted 22, 284,351 22, 284,351 22, 284,351 22, 284,351 22, 284,351 22, 284,351 22, 284,351 After-Tax Non-GAAP Distributable Earnings Per Share Basic and Diluted $ 0. 10 $ 0. 15 $ 0. 10 $ 0. 24 $ 0. 12 $ 0. 25 $ 0. 26 ¹ Pro forma assumes the Transactions and IPO occurred prior to reported period 24
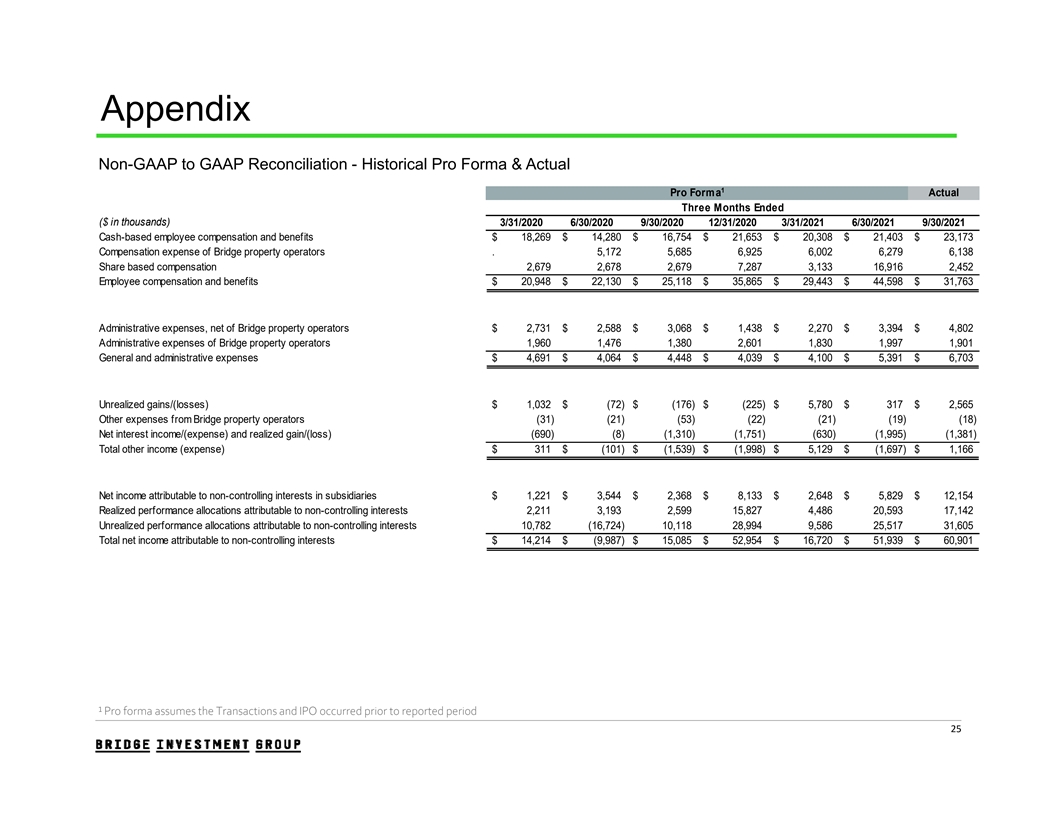
Appendix Non-GAAP to GAAP Reconciliation - Historical Pro Forma & Actual 1 Pro Forma Actual Three Months Ended ($ in thousands) 3/31/2020 6/30/2020 9/30/2020 12/31/2020 3/31/2021 6/30/2021 9/30/2021 Cash-based employee compensation and benefits $ 18,269 $ 14,280 $ 16,754 $ 21,653 $ 20,308 $ 21,403 $ 23,173 Compensation expense of Bridge property operators . 5,172 5,685 6,925 6,002 6,279 6,138 Share based compensation 2,679 2,678 2,679 7,287 3,133 16,916 2,452 Employee compensation and benefits $ 20,948 $ 22,130 $ 25,118 $ 35,865 $ 29,443 $ 44,598 $ 31,763 Administrative expenses, net of Bridge property operators $ 2,731 $ 2,588 $ 3,068 $ 1,438 $ 2,270 $ 3,394 $ 4,802 Administrative expenses of Bridge property operators 1,960 1,476 1,380 2,601 1,830 1,997 1,901 General and administrative expenses $ 4,691 $ 4,064 $ 4,448 $ 4,039 $ 4,100 $ 5,391 $ 6,703 Unrealized gains/(losses) $ 1,032 $ (72) $ (176) $ (225) $ 5,780 $ 317 $ 2,565 Other expenses from Bridge property operators (31) (21) (53) (22) (21) (19) (18) Net interest income/(expense) and realized gain/(loss) (690) (8) (1,310) (1,751) (630) (1,995) (1,381) Total other income (expense) $ 311 $ (101) $ (1,539) $ (1,998) $ 5,129 $ (1,697) $ 1,166 Net income attributable to non-controlling interests in subsidiaries $ 1,221 $ 3,544 $ 2,368 $ 8,133 $ 2,648 $ 5,829 $ 12,154 Realized performance allocations attributable to non-controlling interests 2,211 3,193 2,599 15,827 4,486 20,593 17,142 Unrealized performance allocations attributable to non-controlling interests 10,782 (16,724) 10,118 28,994 9,586 25,517 31,605 Total net income attributable to non-controlling interests $ 14,214 $ (9,987) $ 15,085 $ 52,954 $ 16,720 $ 51,939 $ 60,901 ¹ Pro forma assumes the Transactions and IPO occurred prior to reported period 25
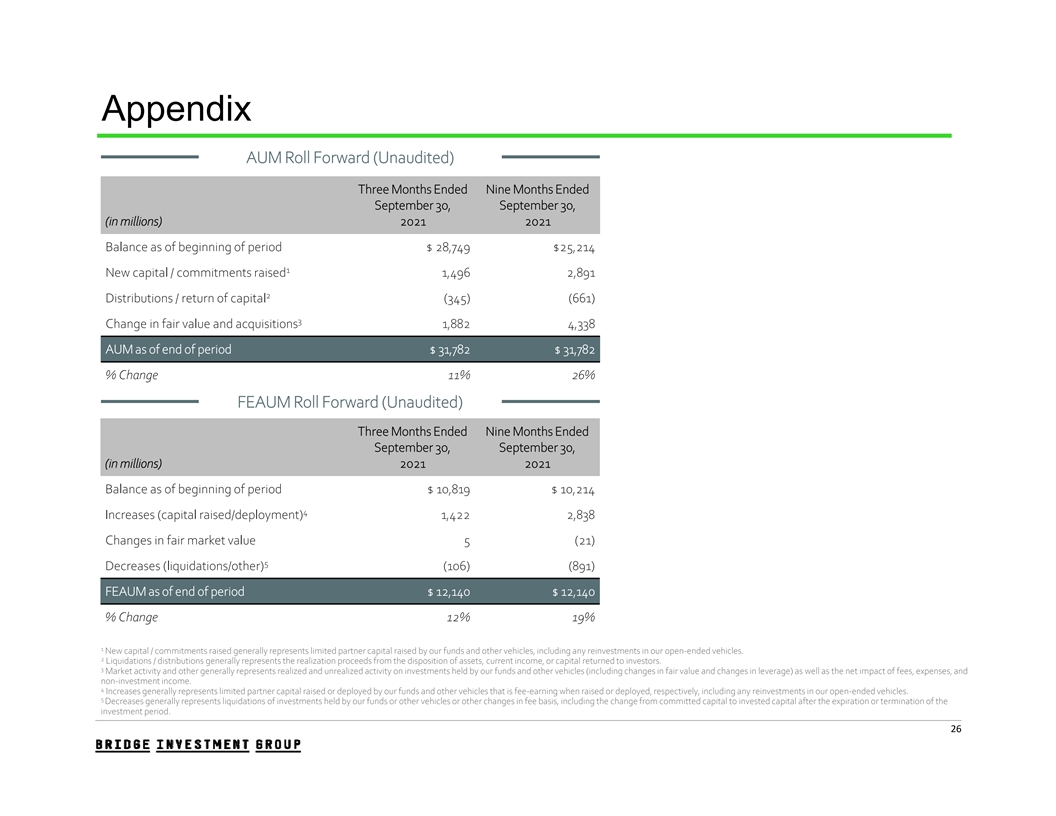
Appendix AUM Roll Forward (Unaudited) Three Months Ended Nine Months Ended September 30, September 30, (in millions) 2021 2021 Balance as of beginning of period $ 28,749 $25,214 1 New capital / commitments raised 1,496 2,891 2 Distributions / return of capital (345) (661) 3 Change in fair value and acquisitions 1,882 4,338 AUM as of end of period $ 31,782 $ 31,782 % Change 11% 26% FEAUM Roll Forward (Unaudited) Three Months Ended Nine Months Ended September 30, September 30, (in millions) 2021 2021 Balance as of beginning of period $ 10,819 $ 10,214 4 Increases (capital raised/deployment) 1,422 2,838 Changes in fair market value 5 (21) 5 Decreases (liquidations/other) (106) (891) FEAUM as of end of period $ 12,140 $ 12,140 % Change 12% 19% 1 New capital / commitments raised generally represents limited partner capital raised by our funds and other vehicles, including any reinvestments in our open-ended vehicles. 2 Liquidations / distributions generally represents the realization proceeds from the disposition of assets, current income, or capital returned to investors. 3 Market activity and other generally represents realized and unrealized activity on investments held by our funds and other vehicles (including changes in fair value and changes in leverage) as well as the net impact of fees, expenses, and non-investment income. 4 Increases generally represents limited partner capital raised or deployed by our funds and other vehicles that is fee-earning when raised or deployed, respectively, including any reinvestments in our open-ended vehicles. 5 Decreases generally represents liquidations of investments held by our funds or other vehicles or other changes in fee basis, including the change from committed capital to invested capital after the expiration or termination of the investment period. 26
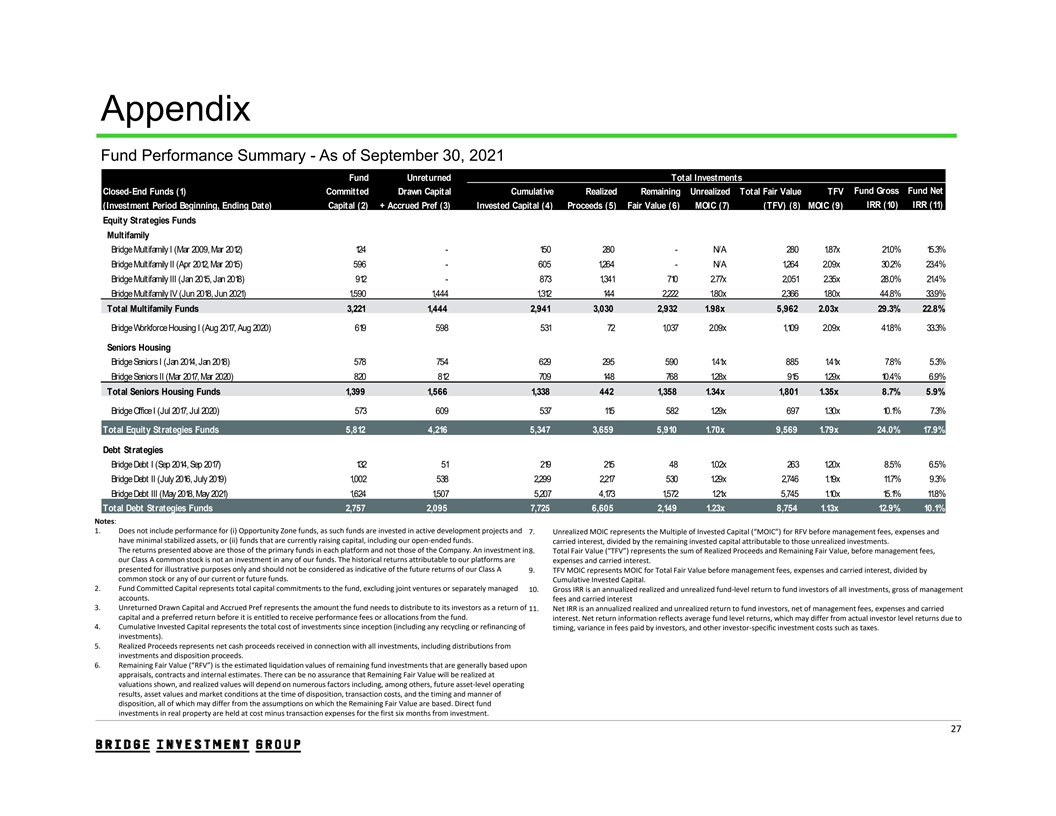
Appendix Fund Performance Summary - As of September 30, 2021 Fund Unreturned Total Investments Closed-End Funds (1) Committed Drawn Capital Cumulative Realized Remaining Unrealized Total Fair Value TFV Fund Gross Fund Net IRR (10) IRR (11) (Investment Period Beginning, Ending Date) Capital (2) + Accrued Pref (3) Invested Capital (4) Proceeds (5) Fair Value (6) MOIC (7) (TFV) (8) MOIC (9) Equity Strategies Funds Multifamily Bridge Multifamily I (Mar 2009, Mar 2012) 1 24 - 150 280 - N/A 280 1.87x 21.0% 15.3% Bridge Multifamily II (Apr 2012, Mar 2015) 596 - 605 1,264 - N/A 1,264 2.09x 30.2% 23.4% Bridge Multifamily III (Jan 2015, Jan 2018) 9 12 - 873 1,341 710 2.77x 2,051 2.35x 28.0% 21.4% Bridge Multifamily IV (Jun 201 8, Jun 2021 ) 1 ,590 1,444 1 ,312 144 2,222 1.80x 2,366 1.80x 44.8% 33.9% Total Multifamily Funds 3,221 1,444 2,941 3,030 2,932 1.98x 5,962 2.03x 29.3% 22.8% Bridge Workforce Housing I (Aug 2017, Aug 2020) 619 598 531 72 1,037 2.09x 1,109 2.09x 41.8% 33.3% Seniors Housing B ridge S eniors I (Jan 201 4, Jan 201 8) 578 754 6 29 295 590 1.41x 885 1.41x 7.8% 5.3% B ridge S eniors II (Mar 201 7 , Mar 2020) 820 812 7 09 148 768 1.28x 915 1.29x 10.4% 6.9% Total Seniors Housing Funds 1 ,399 1,566 1,338 442 1,358 1.34x 1,801 1.35x 8.7% 5.9% Bridge Office I (Jul 2017, Jul 2020) 573 609 537 115 582 1.29x 697 1.30x 10.1% 7.3% Total Equity Strategies Funds 5 ,812 4,216 5,347 3,659 5,910 1.70x 9,569 1.79x 24.0% 17.9% Debt Strategies Bridge Debt I (Sep 2014, Sep 2017) 132 51 219 215 48 1.02x 263 1.20x 8.5% 6.5% Bridge Debt II (July 2016, July 2019) 1,002 538 2,299 2,217 530 1.29x 2,746 1.19x 11.7% 9.3% Bridge Debt III (May 2018, May 2021) 1,624 1,507 5,207 4,173 1,572 1.21x 5,745 1.10x 15.1% 11.8% Total Debt Strategies Funds 2 ,757 2,095 7,725 6,605 2,149 1.23x 8,754 1.13x 12.9% 10.1% Notes: 1. Does not include performance for (i) Opportunity Zone funds, as such funds are invested in active development projects and 7. Unrealized MOIC represents the Multiple of Invested Capital (“MOIC”) for RFV before management fees, expenses and have minimal stabilized assets, or (ii) funds that are currently raising capital, including our open‐ended funds. carried interest, divided by the remaining invested capital attributable to those unrealized investments. The returns presented above are those of the primary funds in each platform and not those of the Company. An investment in 8. Total Fair Value (“TFV”) represents the sum of Realized Proceeds and Remaining Fair Value, before management fees, our Class A common stock is not an investment in any of our funds. The historical returns attributable to our platforms are expenses and carried interest. presented for illustrative purposes only and should not be considered as indicative of the future returns of our Class A 9. TFV MOIC represents MOIC for Total Fair Value before management fees, expenses and carried interest, divided by common stock or any of our current or future funds. Cumulative Invested Capital. 2. Fund Committed Capital represents total capital commitments to the fund, excluding joint ventures or separately managed 10. Gross IRR is an annualized realized and unrealized fund‐level return to fund investors of all investments, gross of management accounts. fees and carried interest 3. Unreturned Drawn Capital and Accrued Pref represents the amount the fund needs to distribute to its investors as a return of 11. Net IRR is an annualized realized and unrealized return to fund investors, net of management fees, expenses and carried capital and a preferred return before it is entitled to receive performance fees or allocations from the fund. interest. Net return information reflects average fund level returns, which may differ from actual investor level returns due to 4. Cumulative Invested Capital represents the total cost of investments since inception (including any recycling or refinancing of timing, variance in fees paid by investors, and other investor‐specific investment costs such as taxes. investments). 5. Realized Proceeds represents net cash proceeds received in connection with all investments, including distributions from investments and disposition proceeds. 6. Remaining Fair Value (“RFV”) is the estimated liquidation values of remaining fund investments that are generally based upon appraisals, contracts and internal estimates. There can be no assurance that Remaining Fair Value will be realized at valuations shown, and realized values will depend on numerous factors including, among others, future asset‐level operating results, asset values and market conditions at the time of disposition, transaction costs, and the timing and manner of disposition, all of which may differ from the assumptions on which the Remaining Fair Value are based. Direct fund investments in real property are held at cost minus transaction expenses for the first six months from investment. 27
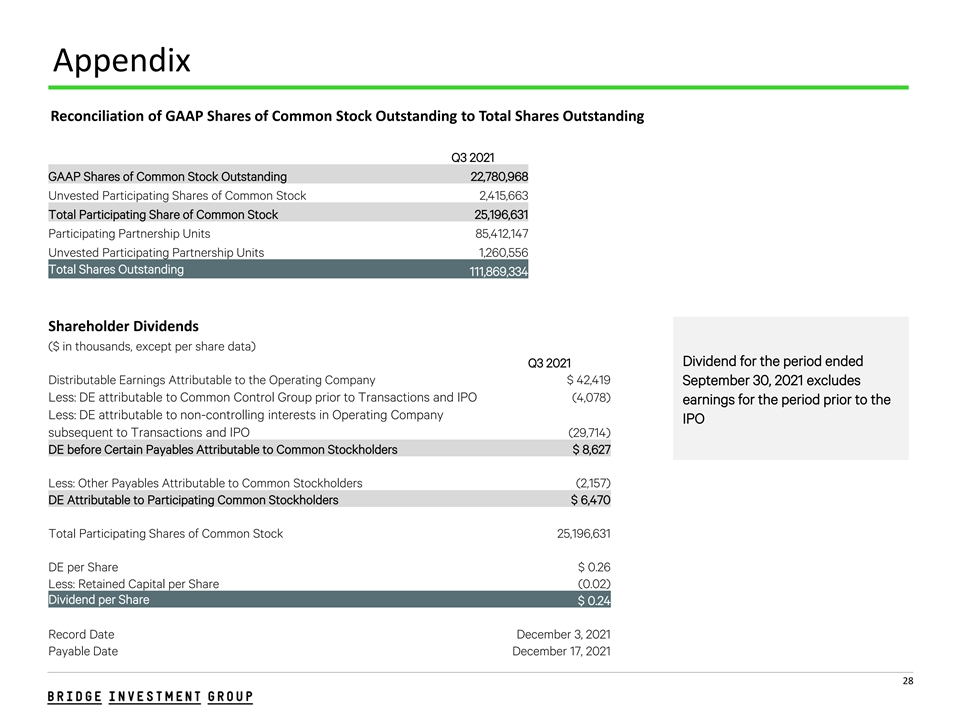
Appendix Reconciliation of GAAP Shares of Common Stock Outstanding to Total Shares Outstanding Q3 2021 GAAP Shares of Common Stock Outstanding 22,780,968 Unvested Participating Shares of Common Stock 2,415,663 Total Participating Share of Common Stock 25,196,631 Participating Partnership Units 85,412,147 Unvested Participating Partnership Units 1,260,556 Total Shares Outstanding 111,869,334 Shareholder Dividends ($ in thousands, except per share data) Dividend for the period ended Q3 2021 Distributable Earnings Attributable to the Operating Company $ 42,419 September 30, 2021 excludes Less: DE attributable to Common Control Group prior to Transactions and IPO (4,078) earnings for the period prior to the Less: DE attributable to non-controlling interests in Operating Company IPO subsequent to Transactions and IPO (29,714) DE before Certain Payables Attributable to Common Stockholders $ 8,627 Less: Other Payables Attributable to Common Stockholders (2,157) DE Attributable to Participating Common Stockholders $ 6,470 Total Participating Shares of Common Stock 25,196,631 DE per Share $ 0.26 Less: Retained Capital per Share (0.02) Dividend per Share $ 0.24 Record Date December 3, 2021 Payable Date December 17, 2021 28

Appendix Reconciliation of Earnings per Share to Distributable Earnings per Share Q3 2021 ($ in thousands, except per share data) Amount # of Shares Amount per Share Net Income Available to Common Stockholders $ 9,315 22,780,968 $ 0.41 Add: Income Allocated to Participating Shares of Restricted Stock 988 Net Income Attributable to Bridge Investment Group Holdings Inc. $ 10,303 25,196,631 $ 0.41 Net income attributable to non-controlling interests in Operating Company 43,904 Net income attributable to Common Control Group prior to Transactions and IPO 3,775 Net income attributable to non-controlling interests in subsidiaries of Operating Company 60,900 Net income $ 118,882 111,869,334 $ 1.06 Income tax provision 2,607 Income before provision for income taxes $ 121,489 111,869,334 $ 1.09 Depreciation and amortization 699 Less: Unrealized performance allocations (53,042) Plus: Unrealized performance allocations compensation 2,682 Less: Unrealized (gains)/losses (2,565) Plus: Share-based compensation 2,452 Less: Net realized performance allocations attributable to non-controlling interests (12,153) Less: Net income attributable to non-controlling interests in subsidiaries of Operating Company (17,142) Distributable Earnings attributable to the Operating Company $ 42,419 111,869,334 $ 0.38 Less: DE attributable to Common Control Group prior to Transactions and IPO (4,078) Less: DE attributable to non-controlling interests in Operating Company subsequent to Transactions and IPO (29,714) 86,672,703 $ 0.34 Distributable Earnings attributable to Bridge Investment Group Holdings Inc. $ 8,627 25,196,631 $ 0.34 29
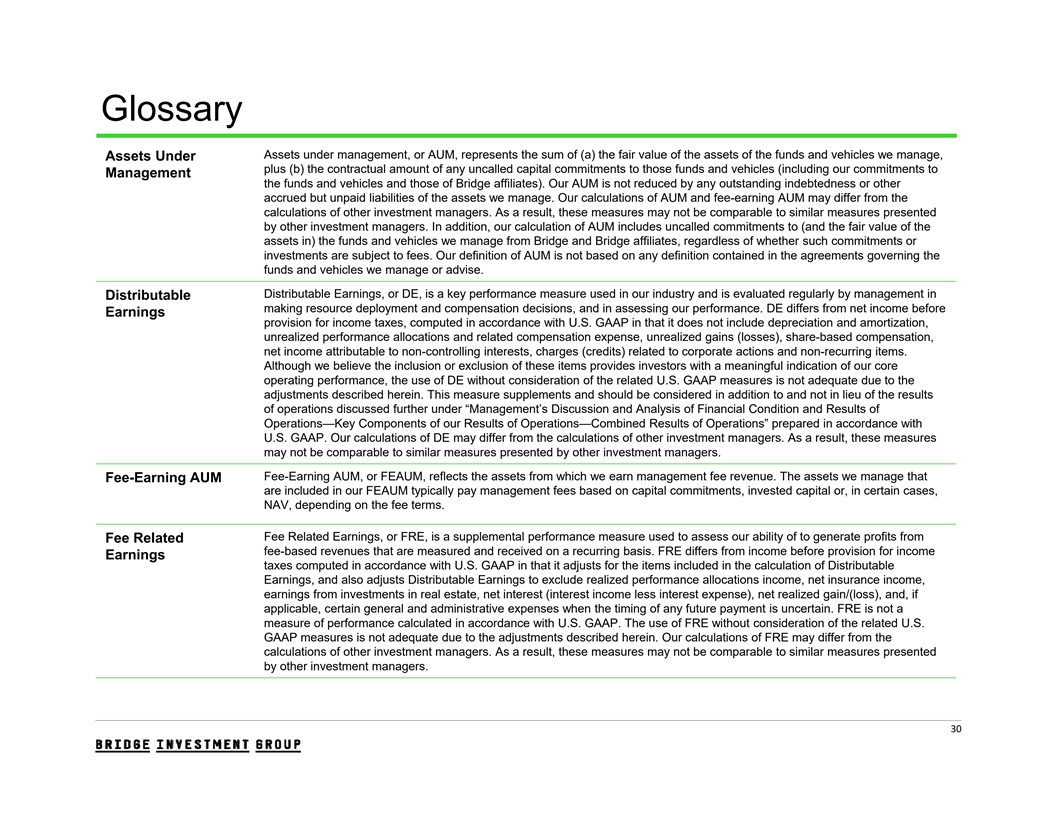
Glossary Assets under management, or AUM, represents the sum of (a) the fair value of the assets of the funds and vehicles we manage, Assets Under plus (b) the contractual amount of any uncalled capital commitments to those funds and vehicles (including our commitments to Management the funds and vehicles and those of Bridge affiliates). Our AUM is not reduced by any outstanding indebtedness or other accrued but unpaid liabilities of the assets we manage. Our calculations of AUM and fee-earning AUM may differ from the calculations of other investment managers. As a result, these measures may not be comparable to similar measures presented by other investment managers. In addition, our calculation of AUM includes uncalled commitments to (and the fair value of the assets in) the funds and vehicles we manage from Bridge and Bridge affiliates, regardless of whether such commitments or investments are subject to fees. Our definition of AUM is not based on any definition contained in the agreements governing the funds and vehicles we manage or advise. Distributable Earnings, or DE, is a key performance measure used in our industry and is evaluated regularly by management in Distributable making resource deployment and compensation decisions, and in assessing our performance. DE differs from net income before Earnings provision for income taxes, computed in accordance with U.S. GAAP in that it does not include depreciation and amortization, unrealized performance allocations and related compensation expense, unrealized gains (losses), share-based compensation, net income attributable to non-controlling interests, charges (credits) related to corporate actions and non-recurring items. Although we believe the inclusion or exclusion of these items provides investors with a meaningful indication of our core operating performance, the use of DE without consideration of the related U.S. GAAP measures is not adequate due to the adjustments described herein. This measure supplements and should be considered in addition to and not in lieu of the results of operations discussed further under “Management’s Discussion and Analysis of Financial Condition and Results of Operations—Key Components of our Results of Operations—Combined Results of Operations” prepared in accordance with U.S. GAAP. Our calculations of DE may differ from the calculations of other investment managers. As a result, these measures may not be comparable to similar measures presented by other investment managers. Fee-Earning AUM, or FEAUM, reflects the assets from which we earn management fee revenue. The assets we manage that Fee-Earning AUM are included in our FEAUM typically pay management fees based on capital commitments, invested capital or, in certain cases, NAV, depending on the fee terms. Fee Related Earnings, or FRE, is a supplemental performance measure used to assess our ability of to generate profits from Fee Related fee-based revenues that are measured and received on a recurring basis. FRE differs from income before provision for income Earnings taxes computed in accordance with U.S. GAAP in that it adjusts for the items included in the calculation of Distributable Earnings, and also adjusts Distributable Earnings to exclude realized performance allocations income, net insurance income, earnings from investments in real estate, net interest (interest income less interest expense), net realized gain/(loss), and, if applicable, certain general and administrative expenses when the timing of any future payment is uncertain. FRE is not a measure of performance calculated in accordance with U.S. GAAP. The use of FRE without consideration of the related U.S. GAAP measures is not adequate due to the adjustments described herein. Our calculations of FRE may differ from the calculations of other investment managers. As a result, these measures may not be comparable to similar measures presented by other investment managers. 30
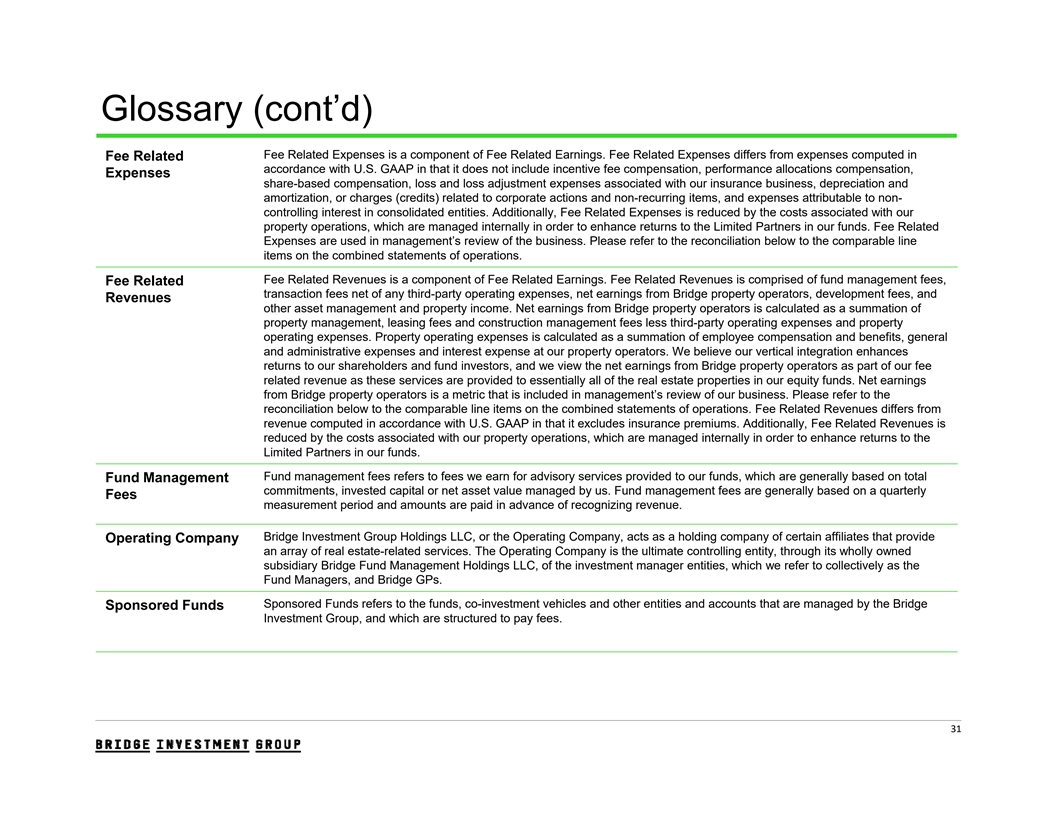
Glossary (cont’d) Fee Related Expenses is a component of Fee Related Earnings. Fee Related Expenses differs from expenses computed in Fee Related accordance with U.S. GAAP in that it does not include incentive fee compensation, performance allocations compensation, Expenses share-based compensation, loss and loss adjustment expenses associated with our insurance business, depreciation and amortization, or charges (credits) related to corporate actions and non-recurring items, and expenses attributable to non- controlling interest in consolidated entities. Additionally, Fee Related Expenses is reduced by the costs associated with our property operations, which are managed internally in order to enhance returns to the Limited Partners in our funds. Fee Related Expenses are used in management’s review of the business. Please refer to the reconciliation below to the comparable line items on the combined statements of operations. Fee Related Revenues is a component of Fee Related Earnings. Fee Related Revenues is comprised of fund management fees, Fee Related transaction fees net of any third-party operating expenses, net earnings from Bridge property operators, development fees, and Revenues other asset management and property income. Net earnings from Bridge property operators is calculated as a summation of property management, leasing fees and construction management fees less third-party operating expenses and property operating expenses. Property operating expenses is calculated as a summation of employee compensation and benefits, general and administrative expenses and interest expense at our property operators. We believe our vertical integration enhances returns to our shareholders and fund investors, and we view the net earnings from Bridge property operators as part of our fee related revenue as these services are provided to essentially all of the real estate properties in our equity funds. Net earnings from Bridge property operators is a metric that is included in management’s review of our business. Please refer to the reconciliation below to the comparable line items on the combined statements of operations. Fee Related Revenues differs from revenue computed in accordance with U.S. GAAP in that it excludes insurance premiums. Additionally, Fee Related Revenues is reduced by the costs associated with our property operations, which are managed internally in order to enhance returns to the Limited Partners in our funds. Fund management fees refers to fees we earn for advisory services provided to our funds, which are generally based on total Fund Management commitments, invested capital or net asset value managed by us. Fund management fees are generally based on a quarterly Fees measurement period and amounts are paid in advance of recognizing revenue. Bridge Investment Group Holdings LLC, or the Operating Company, acts as a holding company of certain affiliates that provide Operating Company an array of real estate-related services. The Operating Company is the ultimate controlling entity, through its wholly owned subsidiary Bridge Fund Management Holdings LLC, of the investment manager entities, which we refer to collectively as the Fund Managers, and Bridge GPs. Sponsored Funds refers to the funds, co-investment vehicles and other entities and accounts that are managed by the Bridge Sponsored Funds Investment Group, and which are structured to pay fees. 31