UNITED STATES
SECURITIES AND EXCHANGE COMMISSION
WASHINGTON, D.C. 20549
FORM
(Mark One)
For the fiscal year ended
OR
For the transition period from to ____________
Commission File Number:
(Exact name of Registrant as specified in its charter)
(State or other jurisdiction of incorporation or organization) |
(I.R.S. Employer Identification No.) |
|
|
(Address of principal executive offices) |
(Zip Code) |
Registrant’s telephone number, including area code: (
Securities registered pursuant to Section 12(b) of the Act:
Title of each class
|
Trading Symbol(s)
|
Name of each exchange on which registered
|
per share |
Securities registered pursuant to Section 12(g) of the Act: None
Indicate by check mark if the Registrant is a well-known seasoned issuer, as defined in Rule 405 of the Securities Act. YES ☐
Indicate by check mark if the Registrant is not required to file reports pursuant to Section 13 or 15(d) of the Act. YES ☐
Indicate by check mark whether the Registrant (1) has filed all reports required to be filed by Section 13 or 15(d) of the Securities Exchange Act of 1934 during the preceding 12 months (or for such shorter period that the Registrant was required to file such reports), and (2) has been subject to such filing requirements for the past 90 days.
Indicate by check mark whether the Registrant has submitted electronically every Interactive Data File required to be submitted pursuant to Rule 405 of Regulation S-T (§232.405 of this chapter) during the preceding 12 months (or for such shorter period that the Registrant was required to submit such files).
Indicate by check mark whether the registrant is a large accelerated filer, an accelerated filer, a non-accelerated filer, smaller reporting company, or an emerging growth company. See the definitions of “large accelerated filer,” “accelerated filer,” “smaller reporting company,” and “emerging growth company” in Rule 12b-2 of the Exchange Act.
Large Accelerated filer |
☐ |
Accelerated filer |
☐ |
|
|
|
|
☒ |
Smaller reporting company |
||
|
|
|
|
Emerging growth company |
|
|
If an emerging growth company, indicate by check mark if the registrant has elected not to use the extended transition period for complying with any new or revised financial accounting standards provided pursuant to Section 13(a) of the Exchange Act.
Indicate by check mark whether the registrant has filed a report on and attestation to its management’s assessment of the effectiveness of its internal control over financial reporting under Section 404(b) of the Sarbanes-Oxley Act (15 U.S.C. 7262(b)) by the registered public accounting firm that prepared or issued its audit report. Yes
Indicate by check mark whether the registrant is a shell company (as defined in Rule 12b-2 of the Exchange Act). Yes ☐ No
As of June 30, 2021, the last business day of the registrant’s most recently completed second fiscal quarter, there was
As of March 1, 2022, the registrant had
DOCUMENTS INCORPORATED BY REFERENCE:
Part III of this Form 10-K incorporates by reference information from the Registrant’s definitive proxy statement related to the 2022 annual meeting of stockholders.
TABLE OF CONTENTS
i
FORWARD-LOOKING STATEMENTS
This annual report on Form 10-K may contain forward-looking statements within the meaning of Section 27A of the U.S. Securities Act of 1933, as amended, or the Securities Act, and Section 21E of the U.S. Securities Exchange Act of 1934, as amended, or the Exchange Act, about, among other things, our operations, taxes, earnings and financial performance, and dividends. All statements other than statements of historical facts contained in this report may be forward-looking statements. Statements regarding our future results of operations and financial position, business strategy and plans and objectives of management for future operations, including, among others, statements regarding expected growth, future capital expenditures, fund performance and debt service obligations, are forward-looking statements. In some cases, you can identify forward-looking statements by terms such as “outlook,” “indicator,” “may,” “will,” “should,” “expects,” “plans,” “seek,” “anticipates,” “plan,” “forecasts,” “could,” “intends,” “targets,” “projects,” “contemplates,” “believes,” “estimates,” “predicts,” “potential” or “continue” or the negative of these terms or other similar expressions. Accordingly, we caution you that any such forward looking statements are not guarantees of future performance and are subject to risks, assumptions and uncertainties that are difficult to predict and beyond our ability to control. Although we believe that the expectations reflected in these forward-looking statements are reasonable as of the date made, actual results may prove to be materially different from the results expressed or implied by the forward-looking statements.
There are or will be important factors that could cause our actual results to differ materially from those indicated in these forward-looking statements, including those described in “Risk Factors” and “Management’s Discussion and Analysis of Financial Condition and Results of Operations” and elsewhere in this report. Such factors should not be construed as exhaustive and should be read together with the other cautionary statements included in this report. If one or more events related to these or other risks or uncertainties materialize, or if our underlying assumptions prove to be incorrect, actual results may differ materially from what we anticipate. Many of the important factors that will determine these results are beyond our ability to control or predict. Accordingly, you should not place undue reliance on any such forward-looking statements. Any forward-looking statement speaks only as of the date on which it is made, and, except as otherwise required by law, we do not undertake any obligation to publicly update or review any forward-looking statement, whether as a result of new information, future developments or otherwise. New factors emerge from time to time, and it is not possible for us to predict which will arise. In addition, we cannot assess the impact of each factor on our business or the extent to which any factor, or combination of factors, may cause actual results to differ materially from those contained in any forward-looking statements.
In addition, statements that “we believe” and similar statements reflect our beliefs and opinions on the relevant subject. These statements are based upon information available to us as of the date of this report, and while we believe such information forms a reasonable basis for such statements, such information may be limited or incomplete, and our statements should not be read to indicate that we have conducted an exhaustive inquiry into, or review of, all potentially available relevant information. These statements are inherently uncertain and you are cautioned not to rely unduly upon these statements.
CERTAIN DEFINITIONS
As used in this annual report on Form 10-K, unless the context otherwise requires, references to:
1
2
RISK FACTOR SUMMARY
The following is only a summary of the principal risks that may materially adversely affect our business, financial condition, results of operations and cash flows. The following should be read in conjunction with the more complete discussion of the risk factors we face, which are set forth more fully in “Part I. Item IA. Risk Factors.”
3
PART I
Item 1. Business
Overview
We are a leading, vertically integrated real estate investment manager, diversified across specialized asset classes, with approximately $36.3 billion of AUM as of December 31, 2021. Our ability to scale our specialized and operationally driven investment approach across multiple attractive sectors within real estate equity and debt, in a way that creates sustainable and thriving communities, is the ethos of who we are and the growth engine of our success. We have enjoyed significant growth since our establishment as an institutional fund manager in 2009, driven by strong investment returns and our successful efforts to develop an array of investment platforms focused on sectors of the U.S. real estate market that we believe are the most attractive. We have extensive multi-channel distribution capabilities and currently manage capital on behalf of more than 180 global institutions and more than 10,000 individual investors across our investment strategies.
As of December 31, 2021, we employed approximately 1,800 people primarily located at our corporate offices in Utah, New York, California, Florida, Georgia and Virginia and our properties throughout the country. Additionally, we have approximately 2,450 professionals employed through a professional employment organization at sites managed by Bridge Senior Living, all of whom are expensed via our managed vehicles. Our employees and professionals are integral to our culture of integrity, professionalism and excellence. We believe hiring, training and retaining talented individuals, coupled with our rigorous investment process, has supported our excellent investment record over many years. This record, in turn, has enabled us to innovate into new strategies, drive growth and better serve our fund investors and shareholders.
4
We employ a specialized, vertically integrated model spanning ten investment platforms across real estate equity and debt strategies. Our vertically integrated approach includes investment professionals as well as employees who perform active asset management, property management, leasing, and construction management functions. By directly operating the properties that we acquire or develop, we are able to find opportunities to generate significant alpha at the asset level, creating a key competitive advantage to drive returns for our fund investors. This high-touch owner-operator approach, which we have refined over decades, provides a difficult to replicate, data-driven investment strategy. With respect to our equity investment strategies, we aim for high visibility into precisely how we will execute on and operate a given asset at the time of acquisition. In our Debt Strategies platform, we leverage that same execution-focused discipline to validate and underwrite credit investments, frequently collaborating with our local market teams in the investment phase.
We currently operate across 35 states, and we focus our investment activity in the U.S. markets that we believe exhibit the strongest growth potential, as determined by rigorous data-driven analytics conducted by our dedicated research team. We have a leading presence in many attractive subsectors of U.S. real estate in both primary and secondary markets. Our investment teams consist of specialized, experienced professionals who bring deep sector knowledge across economic cycles. Investment team collaboration combined with our on-the-ground resources and local market teams provides us with extensive and unique deal flow across our target markets. Our intensive underwriting and investment processes benefit from this collaborative effort to support rigorous physical, financial and analytical due diligence.
We are focused on a differentiated and socially responsible approach to investing and operating our assets. Our onsite presence at our properties allows us to create positive, constructive relationships with residents and tenants, and to differentiate Bridge real estate assets from other properties. By making improvements that residents and tenants value, often with an emphasis on social and community programming, Bridge prides itself on community revitalization. Further, we seek to make improvements that limit our impact on the environment. For example, in 2021 we launched an innovative solar power program that has been implemented at one office asset and is being planned or underwritten at additional office and multifamily assets. Community, sustainability and resource reduction are incorporated into our decisions. As an operator, we seek to offer residents and tenants far more than just “four walls and a roof.” We are a signatory of the United Nations Principles for Responsible Investment, or UNPRI, and are seeking to incorporate environmental, social and governance issues into our investment analysis and decision-making processes. We believe this will improve long-term, risk-adjusted returns for our fund investors and deliver to our tenants and residents what they need and want.
Our distribution efforts span both retail and institutional channels and are led by our senior management, investment professionals and a dedicated team of global investor service professionals. We established our retail distribution channel through our first wirehouse distribution relationship in 2012, and we believe our tenured presence with distribution partners, including wirehouse banks and Registered Investment Advisers, or RIAs, affords us the opportunity to continue growing our AUM from retail investors. Our institutional fundraising and fund investor service efforts are high-touch, and we manage capital on behalf many of the world’s leading global allocators of private market capital. Because of our multiple platforms and strategies, we are frequently in front of our fund investors to maintain and expand these relationships, and we communicate in a detailed and transparent way with our fund investors. The combination of strong investment returns and regular, intensive communications has created strong loyalty and repeat investments from leading institutional investors. Our focus on performance, detailed and transparent communication, and responsiveness are among the factors that differentiate our fund investor relations approach.
Our investment teams are supported by a centralized corporate infrastructure providing debt capital markets, risk management, client solutions and back-office support functions. The substantial recent investments we have made in our corporate infrastructure to service all Bridge investment teams enables us to scale our platform to accommodate significant future platform growth. The bulk of our corporate infrastructure is located in Salt Lake City, Utah, which offers a high-quality labor pool at a lower cost than many larger metropolitan areas.
We have a long history of disciplined and strategic corporate growth, and we have successfully expanded into multiple new investment verticals since our initial investment fund via organic growth initiatives, strategic personnel hiring, and corporate acquisitions, while remaining focused on driving value at the underlying investment level. We believe we have a sustained opportunity to continue to apply our investment principles into additional sectors, strategies and markets.
5
We have an experienced management team with proven performance history and long-term tenure and outlook. Our leaders have deep knowledge of the local markets in which we invest coupled with extensive real asset and capital markets expertise. We have consistently practiced intensive, formal management training to optimize the performance of our professionals and employ rigorous performance reviews to support career development and advancement. We conduct regular succession planning and generally employ a “Co-Chief Investment Officer” structure or have a Deputy Chief Investment Officer for each investment vehicle. We strive to be a best-in-class employer of choice and seek to provide competitive career opportunities and benefits to our employees. We have been able to attract and retain high-quality personnel, at both the entry level and the mid-and senior levels. We consistently reexamine and seek to optimize the Bridge culture of mutual shared success and teamwork and commit meaningful resources to knowledge sharing across verticals.
Our History
Our founders began investing in multifamily real estate in 1991. In 2000, this predecessor group adopted our current vertically integrated strategy with the addition of a multifamily property management affiliate, now known as Bridge Property Management, and continued to build a strong reputation with institutional capital allocators as a regional real estate sponsor. In 2009, this predecessor group partnered with other members of our current executive management to launch our first discretionary investment fund, Bridge Multifamily Fund I, and with the success of that fund these predecessor groups combined to form our Operating Company in 2011 and launched Bridge Multifamily Fund II at the beginning of 2012. We and our founders have successfully managed commercial real estate investments with resiliency and adept actions through multiple cycles and financial market challenges. Through 2021, we sponsored a total of 22 funds, as well as a variety of separate accounts, co-investment vehicles and managed joint-venture investment entities across our nine investment platforms. In January 2022, we added our tenth investment platform and launched our single-family rental strategy and associated vehicles. We have built on this successful history by leveraging our best-in-class operational infrastructure and capital raising abilities to grow from a single investment strategy to a diversified group of specialized investment platforms both through building specialized teams with new hires and through acquiring emerging companies.
Today, we provide investors with a diverse range of real estate investment products managed by our dedicated, specialized and synergistic investment teams. Our broad range of products allows us to capture new market opportunities and serve investors with various investment objectives. Since the beginning of 2009, we have raised approximately $20 billion of equity commitments across our funds and investment vehicles and, as of December 31, 2021, we had approximately $36.3 billion of AUM across our funds and other vehicles.
Market Opportunity
We believe our position as a leading real estate investment manager and expertise in investing in multiple real estate sectors positions us to capitalize on favorable market trends, such as:
Growth in Institutional Wealth Driving Increasing Demand for Real Estate Investment Opportunity
We operate in the large and growing real estate investment management industry, which we believe represents one of the most attractive segments within the broader asset management industry. According to PricewaterhouseCoopers’ 2020 report, Asset and wealth management revolution: The power to shape the future, or the PwC 2020 Report, total global AUM is expected to grow from approximately $111.2 trillion in 2020 to approximately $145.4 trillion in 2025 in all asset classes, implying a CAGR of approximately 5.5%. Investments in alternative assets are projected to grow even more significantly, from $10.7 trillion to $17.2 trillion over the same timeframe, representing a CAGR of 9.8%, according to Preqin Ltd. Within alternatives, real estate represents one of the largest asset classes in North America. According to the National Association of Real Estate Investment Trusts, the total size of the commercial real estate market was estimated to be $20.7 trillion in 2021. We believe investors view allocations to private real estate investments as essential for obtaining diversified exposure to income and growth.
Real Estate Investments Offer Opportunity for Yield in a Low-Rate Environment
We believe yield-oriented strategies, such as certain real estate equity and debt investment strategies, have the potential to generate significant current income and attract investor capital because of their defensive characteristics that may provide returns with less volatility and lower loss ratios than can be achieved via investments in markets outside real estate. In addition to seeking attractive absolute and relative returns, we believe institutional investors have been increasing their allocations to the real estate asset class to attain stable income, low volatility and diversification relative to traditional public market investments.
6
Competitive Strengths
We believe the following competitive strengths will allow us to continue to capitalize on industry trends and position us for further growth:
Vertically Integrated Business Model Drives Competitive Advantages and Attractive Investment Returns. Our vertically integrated business model facilitates our comprehensive top-down investment strategy supported by our deep expertise and robust asset level underwriting. We seek to add value to assets and create asset level alpha through intensive asset and property management strategies such as capital investment, leasing, centralized procurement, operations and maintenance, and creative asset level financing/capitalization. Moreover, we have demonstrated that our knowledge and data aggregation from these intensive asset and property management activities can also be utilized in the context of capital allocation funds, such as our Opportunity Zone funds, to assist our hand-selected operating partners by providing access to selected information.
We believe that the hands-on experience of our vertically integrated teams, together with our top-down market analysis, leads to strong underwriting and returns for the investors in our funds. Our vertical integration also enables us to increase the efficiency of our assets by reducing fees paid to third parties for services such as property management and brokerage, thereby increasing cash flow to our funds.
Diversified and Synergistic Business Model Spanning Ten Investment Platforms. Our ten investment platforms are highly synergistic, working together to provide us a competitive advantage through differentiated underwriting capabilities, enhanced collaboration to increase deal flow via locally based teams across a broad set of markets. Our investment platforms are incentivized to develop and share best practices and are enhanced by our fully scaled corporate infrastructure, with full integration and in-house capabilities across debt capital markets, risk management, procurement and client solutions, which provide a competitive advantage and enhance the economic proposition for fund investors.
We believe this model benefits all our investment platforms. For example, our multifamily property managers conduct physical due diligence on assets relating to potential loan investments by our Debt Strategies platform, and we often underwrite office assets in markets where we have significant on-the-ground multifamily experience.
Bridge’s diverse array of investment platforms creates stability and minimizes risk for our franchise, limiting the key-person risk attributable to any one individual or team and generating income from a wide variety of investments. In addition, we have multiple drivers of AUM growth through our specialized investment platforms and investment vehicles including managed funds, separate accounts and co-investments.
National Reach with Local Expertise. We believe that our extensive nationwide footprint of locally based teams allows us to uncover attractive opportunities on a bottom-up basis in our target markets, providing us enhanced deal flow and contributing to our ability to underwrite deals in specific sub-markets due to our locally sourced knowledge. In addition, our relationships with national brokerage houses across markets and sectors and our relationships with other large institutional property owners allow us to stay abreast of market trends and execute transactions. Our deep local sub-market presence and strong reputation for closing transactions allow us to maintain a robust pipeline of transactions and deal flow.
Proven Record of Fundraising Success with a Loyal Investor Base. We benefit from a diverse investor base with a large number of investors, many of whom have invested in several of our managed vehicles. 58% of Bridge fund investors (including each wirehouse platform as a single investor) have invested in two or more funds, and 15% of our institutional investors have invested in three or more funds. Our experienced Client Solutions Group raises capital and maintains deep relationships with key institutional segments (e.g., sovereign wealth funds, pension funds and insurance companies) as a complement to our extensive wealth management relationships, which span most of the largest wirehouses in the United States. Our Client Solutions Group has a proven history of raising capital and driving growth across new products, platforms and investment teams having raised an average of $2.9 billion of equity capital per year from 2016 through 2021.
High Proportion of Recurring Fees and “Sticky” Contractual Revenue Streams from Long-Duration Capital. We have worked diligently to grow our base of recurring revenue and raise long-duration capital. We have successfully executed this endeavor through a number of closed-end funds, in which investors withdraw capital only at the end of the fund term, which generally ranges from six to ten years. All but two of our current funds are closed-end funds, with average lifespans at inception of eight years or more, in which investors’ contributions are locked in throughout the life of the fund.
7
Our closed-end funds are generally structured to charge fees on committed capital during the initial capital raising and investment period (typically the first three years) and to charge fees on invested capital thereafter. As a result, our fees are inherently “sticky,” as they are initially based upon the commitments our investors have made to our funds and are therefore unlikely to vary meaningfully from year-to-year following a large capital raise.
In most of our equity funds we also generate property management fees, construction management and development fees, mortgage brokerage fees, due diligence fees, and certain other ancillary revenue. These fee streams are contractual and are in some cases tied to the duration of the managed vehicles, providing additional stability and visibility to our revenues and earnings. Following a capital raise, we have a high degree of visibility into the growth of these contractual fee streams. We believe these fees are mutually beneficially to us and our fund investors because we provide these ancillary services at or below market rates and drive better execution by using our size, scale and expertise for our fund investors’ benefit.
Long-tenured Senior Management Team with High Alignment and Support of Deep and Talented Employee Pool. We are a people business and focus on consistently recruiting highly qualified people and empowering them to reach their full potential. We are led by over 30 active senior managing directors, many of whom have worked together for decades. Our owners, employees and affiliates have made, in the aggregate since the inception of Bridge Multifamily Fund I in 2009, capital commitments of over $485 million to our managed funds as of December 31, 2021, helping ensure an alignment of interests with our fund investors. In addition to the ownership interests held by our senior managing directors, certain employees are also eligible to receive share-based compensation to further align the interests of our employees with our shareholders and cultivate a strong sense of ownership and commitment to our Company.
Our nationwide team possesses extensive real estate, investment, operational, capital markets and transactional expertise that cumulatively drives alpha generation at the asset level. We have grown from an employee base of under 1,000 in 2015 to approximately 1,800 current employees (including approximately 1,200 employees who operate our properties but not including employees of a professional employer organizations at certain properties) and have developed a strong internal culture and external brand reputation. Our culture of excellence, accountability, teamwork and collaboration allows employees to thrive in every aspect of their professional lives. We are committed to promoting an environment that fosters each employee’s professional growth and investing in each of our employees through target professional advancement (including tuition reimbursement), mentorship and leadership development. We believe in connecting the right people with the right opportunities to help them drive their careers at Bridge.
We believe our ability to maintain a consistent common culture and vision while having specialized teams around the country focused on specific real estate segments is a point of differentiation. We have developed practices which we believe are unique and contribute to our consistent performance. One such example is our annual Bridge Knowledge Share event, where we bring investment professionals from each investment platform together at our headquarters to collaborate and share best practices, as well as to develop relationships and contacts, which has led to organic collaboration among teams.
Growth Strategy
We have successfully grown via both organic and inorganic expansion throughout our history. As we continue to expand our business, we intend to create value for our shareholders by seeking to:
Continue to Strengthen and Expand Our Fund Investor Network
We believe our existing fund investors and distribution channels are continuing to allocate assets to real estate strategies, while seeking experienced, sector-specific asset managers to execute their real estate investment strategy. Throughout our history, we have invested in and grown both our in-house and third-party distribution networks. Accordingly, we intend to grow our business by expanding our relationships with existing fund investors and by attracting new fund investors who value our established operating platform, sharpshooter investment strategies, and performance history.
8
Expand Our Product Offerings Across the Risk-Return Spectrum
We believe our vertically integrated platform will allow us to add complementary investment products intended to meet differing risk profiles and current yield and return objectives, for existing and new fund investors. At the same time, we believe that our significant access to potential investment opportunities, integrated market research, and financing and operational capabilities will enable us to efficiently source and manage attractive investments that meet a broader range of investment objectives and strategies. We believe that expansion of both investment style and geography provides an opportunity for meaningful growth within our existing strategies. Within or adjacent to our current investment strategies, for example, we added on to our existing value-add Multifamily strategy by launching our Workforce and Affordable Housing strategy with a different risk-return profile for our fund investors.
Launch New Product Offerings and Strategies Across Real Estate and Adjacent Sectors and Pursue Expanded Investment Geography
A key element of our growth has been our ability to apply our deep expertise in real estate to grow complementary investment strategies in additional real estate and real estate-adjacent sectors that offer attractive fundamentals. We have expanded our product offerings to provide an increasing array of opportunities for investors and a balanced business model that we believe benefits all of our stakeholders. For example, in 2020, we launched our Agency Mortgage Backed Securities, or Agency MBS, platform in our first open-end structure. In January 2022, we launched our Single-Family Rental, or SFR, investment platform with the acquisition of the operations of Gorelick Brothers Capital, which added a portfolio of over 2,700 SFR properties supported by a vertically integrated property management platform that also joined the Bridge team. We expect to continue to develop new strategies and products across property types and fund structures. We also anticipate opportunities to expand our investment geography within our existing investment strategies. We believe there are additional expansion opportunities adjacent to our existing strategies that we are uniquely suited to pursue, including those that do not involve traditional real estate assets.
Expand Our Distribution Capabilities Domestically and Internationally
According to the PwC 2020 Report, the combined investable assets of high-net-worth individuals are expected to reach approximately $202.9 trillion by 2025. However, many high-net-worth individual investors continue to have difficulty accessing private real estate investment opportunities because of a lack of available products that satisfy regulatory and structural requirements related to liquidity, transparency and administration. Our investment platform is designed to expand access to the private real estate markets for both institutional and individual fund investors.
We believe that geographically and economically diverse investors require a highly bespoke approach and demand high levels of transparency and reporting. We believe that we will be able to leverage our existing investment and operational capabilities while establishing a local presence in key geographies and expand our fund investor base globally.
We expect our fund investor base to become increasingly international and expect that a growing portion of the capital we raise in 2022 will come from Asia, Europe, the Middle East, and Africa as we continue to expand our presence in these markets. In 2020, we opened an office in Seoul, Korea and expanded our strategies to include registration of certain strategies as alternative investment funds in Luxembourg. In 2021, we opened an office in Luxembourg to expand our coverage of Europe, the Middle East and Africa (EMEA) markets, and we are undertaking the registration process to become a registered alternative investment fund manager, or AIFM. We believe we are well positioned to deepen our private fund investors and institutional fund investors in these markets, among others.
Our Organizational Structure
Bridge Investment Group Holdings Inc. was incorporated as a Delaware corporation on March 18, 2021 in connection with the Transactions, including the IPO. Prior to the IPO, all of our business operations were conducted through Bridge Investment Group LLC (later renamed Bridge Investment Group Holdings LLC), or the Operating Company, and its direct and indirect subsidiaries. The Operating Company was formed on December 2, 2011. Bridge Investment Group Holdings Inc. has not engaged in any material business or other activities apart from its role as the sole managing member of the Operating Company, and its only material asset is its ownership interest in the Operating Company. As the sole managing member of the Operating Company, Bridge Investment Group Holdings Inc. indirectly operates and controls all of the Operating Company’s business and affairs.
9
The Operating Company is the ultimate controlling entity, through its wholly owned subsidiary Bridge Fund Management Holdings LLC, of the following investment manager entities, which we refer to collectively as the Fund Managers: Bridge Multifamily Fund Manager LLC, Bridge Seniors Housing Fund Manager LLC, Bridge Debt Strategies Fund Manager LLC, Bridge Office Fund Manager LLC, Bridge Development Fund Manager LLC, Bridge Agency MBS Fund Manager LLC, Bridge Net Lease Fund Manager LLC, Bridge Logistics Properties Fund Manager LLC, and Bridge Single-Family Rental Fund Manager LLC. The Fund Managers provide real estate and fund investment advisory services on a discretionary basis to multiple investment funds and other vehicles, including joint venture real estate projects, separately managed accounts and privately offered real estate-related limited partnerships, including any parallel investment vehicles and feeder funds, or, collectively, the funds. The Operating Company receives management fees from the funds through the Fund Managers. Each time that we establish a new fund, our direct owners also establish a new general partner for that fund. We refer to these general partners collectively as the Bridge GPs. Prior to the IPO, the Bridge GPs were entitled to any incentive fees or carried interest, which we collectively refer to as performance fees, from the funds. The Operating Company and the Bridge GPs are under common control by the direct owners of the Operating Company and the Bridge GPs. We refer to the direct owners of the Operating Company as our Original Equity Owners. The Operating Company, together with its consolidated subsidiaries and the Bridge GPs, represent the predecessor entity of our business.
Our Investment Platforms
We operate our business, in a single segment, real estate investment management, which includes ten specialized and synergistic investment platforms managed by nine investment teams. Our ten investment platforms include: Multifamily, Workforce and Affordable Housing, Seniors Housing, Office, Development, Net Lease, Logistics Properties, Debt Strategies, Agency MBS, and Single-Family Rental.
Multifamily. Our Multifamily investment platform focuses on assets in growth markets that we believe offer attractive risk-adjusted returns. Our senior executives have focused on multifamily investments for the past 30 years, including previous ventures. Our Multifamily platform generally targets markets with investments within Metropolitan Statistical Areas, MSAs, with household and employment growth rates that are projected to exceed national averages. We believe we have a differentiated approach to multifamily investing, which relies on the integration and coordination of our investment, asset management, debt capital markets and nationwide property management capabilities. We have generated attractive multifamily value-add returns relative to peers, and each of our three most recent multifamily funds is ranked in the first overall quartile among value-add real estate funds with the same vintage year according to Preqin Ltd. Our “owner-operator” model allows us to manage assets internally, with in-house personnel functions such as property management, construction management and leasing. As of December 31, 2021, our Multifamily platform had approximately $8.4 billion of AUM across multiple closed-end funds and related vehicles.
Workforce and Affordable Housing. Our Workforce and Affordable Housing investment platform invests in, creates and preserves affordable rental housing communities for America’s workforce. Our Workforce and Affordable Housing senior executives bring decades of experience focusing on workforce housing investments. We target markets that are projected to have substantially higher household formation and employment growth than the national averages. Our first Workforce and Affordable Housing fund is in the first quartile among funds with the same vintage year for IRR, net multiple and overall return according to Preqin Ltd. With approximately 11 million households spending over 50% of their annual income on housing and a meaningful decline in Class B/C multifamily units as a percentage of total stock since 2000, we believe there is a significant need for affordable housing in the United States. Bridge brings a differentiated and socially responsible approach to investing in workforce housing, focusing on preservation and creation of innovative social programs that drive tenant satisfaction. We leverage our in-house operating platforms to reposition assets with specialized community and life-enhancing services providing more than just “four walls and a roof” to thousands of families across the United States. Our Workforce and Affordable Housing Strategy has received numerous awards in 2021, including being named as “ESG Private Markets Strategy of the Year” by Pension Bridge, winning “Social Fund of the Year” from Environmental Finance Sustainable Investment Awards, and being named winner in the category of “Best ESG Investment Fund: Private Equity,” and runner up in the category of “Best ESG Investment Fund: Real Estate/Property” by ESG Investing. As of December 31, 2021, our Workforce and Affordable Housing platform had approximately $4.3 billion of AUM across multiple closed-end funds and related vehicles.
10
Seniors Housing. Our Seniors Housing investment platform invests in seniors housing assets across the United States. Our Seniors Housing senior executives have decades of experience in the sector and have completed over $9 billion of seniors housing transactions, including previous ventures. We believe that seniors housing is one of the most attractive segments in the United States real estate market, offering sizeable long-term growth potential, significant consolidation opportunities, and durable industry fundamentals. The sector’s growth prospects are driven by the long-term demographics of the aging population, the increased incidences of Alzheimer’s and dementia-related diseases, and the needs-driven demand for the product type. This need has been validated through COVID-19 as new leases have rebounded to pre-pandemic levels in Bridge’s portfolio. We believe that the dramatic spike in the 75-and-older population, which is just beginning will result in a significant supply/demand imbalance that, when coupled with the approaching functional obsolescence of a meaningful portion of existing inventory, provides the fundamentals for an attractive investment opportunity in a sector with a limited supply of institutional quality competitors. Our Seniors Housing platform is a vertically integrated owner-operator and manages properties through our seniors housing property management company, Bridge Senior Living, as well as through third-party operating partners. We believe that our vertical integration enhances our ability to maximize performance, allows for direct control of the sales and marketing functions, and creates greater opportunities to deliver attractive returns to our fund investors. As of December 31, 2021, our Seniors Housing platform had approximately $4.5 billion of AUM across multiple closed-end funds and related vehicles.
Office. Our Office investment platform targets value-add commercial office assets in prime secondary and suburban sub-markets across the United States. Our senior executives have decades of commercial office real estate experience. Our target markets, including Atlanta, Phoenix, Dallas and Miami, among others, generally exhibit higher population growth and have absorbed more offices spaces as a percent of inventory relative to gateway markets, which we believe provides an attractive investment opportunity. Our target markets also have higher entry capitalization rates (defined as net operating income divided by acquisition cost) than gateway markets, which increases our total returns relative to those markets. Our investment approach combines a disciplined asset selection process with a strong focus on leasing and operationally oriented, value-add improvements that increase tenant satisfaction. We strive to offer attractive solutions to tenants and use various strategies that address evolving business needs, including traditional office terms, flexible enterprise solutions and coworking / virtual office space. Our vertically integrated operating platform, local market presence and proximity to our assets allow us to address tenant needs on a comprehensive basis and to transform ordinary office properties into state-of-the-art, modern, appealing workspaces that command premium market rents and maintain high occupancies. This approach enabled Bridge to execute more new leases in each of 2021 and 2020, in the face of the COVID-19 pandemic and uncertainty about the future of the office, than in 2019. We believe that our target prime secondary and suburban sub-markets will benefit from de-urbanization trends in the face of COVID-19 with a favorable cost of living and an opportunity rich environment for knowledge-based workers. As of December 31, 2021, our Office platform had approximately $2.5 billion of AUM multiple closed-end funds and related vehicles.
Development. Our Development investment platform was established in 2019 in order to provide our fund investors an opportunity to capitalize on tax benefits associated with investments in qualified opportunity zones, or QOZs, along with other attractive real estate development-oriented investment opportunities. QOZs were established by the Tax Cuts and Jobs Act of 2017, or the TCJA. The TCJA generally provides investors who make qualifying investments in “qualified opportunity funds” that invest either directly or indirectly in certain geographic locales designated as QOZs with certain significant tax benefits (deferral of and/or exemption from payment of tax on certain capital gains). Our development investment program is multifamily-focused, with over 80% of the equity from our Opportunity Zone funds invested in multifamily development. We believe multifamily investments are well-suited for the 10-year hold required by the QOZ rules due to the persistent need for housing and the resulting consistent rental income of multifamily investments. We focus on investments located in Bridge’s existing target markets. Bridge was an early entrant into QOZ investing and remains one of the largest managers of QOZ-focused investment strategies. Bridge maintains connectivity and insight into regulatory developments as a member of the Opportunity Zone Coalition organized by the Economic Innovation Group. The Opportunity Zone funds within our Development platform have a longer tenor than our other closed-end funds due to the 10-year hold required by the QOZ rules. As of December 31, 2021, our Development platform had approximately $3.7 billion of AUM across multiple closed-end funds and related vehicles.
Net Lease. In the second quarter of 2021, we launched our Net Lease investment platform. Our investment strategy in this new platform focuses on the acquisition and operation of Class A and Class B mission critical industrial, manufacturing, logistics and other critical business infrastructure properties of between 75,000 and 600,000 square feet located in the top 75 MSAs across the United States, and on distribution corridors within growth markets. We focus on tenants in growing sectors and established durable industries including e-commerce, food, manufacturing and business-to-business. We believe that opportunities exist to identify and deploy capital quickly into mispriced assets to strategically build a diverse high yielding portfolio. We focus on multiple deal sourcing channels including traditional broker networks, programmatic build-to-suit relationships, private equity sponsors for sale leasebacks, local developer relationships in target markets and existing tenants. Our Net Lease platform is led by a team of experienced industrial investment professionals, including several recent new hires who previously worked together overseeing industrial net lease investments of a large publicly listed real estate investment trust. As of December 31, 2021, our Net Lease platform had approximately $200 million of AUM in an open-end fund structure that is perpetually deploying capital.
11
Logistics Properties. In the second quarter of 2021, we launched our Logistics Properties investment platform. Our investment strategy in this new platform focuses on the acquisition and operation of value-add and Core-Plus acquisitions of logistics assets as well as ground-up development opportunities predominantly in infill, last-mile driven markets in attractive MSAs. Our Logistics Properties platform is led by a team of experienced industrial investment professionals, including recent new hires who previously worked together overseeing industrial and logistics investments and development projects for one of the largest real estate private equity fund managers. As of December 31, 2021, our Logistics Properties platform had approximately $240 million of AUM.
Debt Strategies. Our Debt Strategies investment platform invests in commercial real estate-backed fixed income opportunities with a primary focus on property types where Bridge has significant internal capabilities and experience including multifamily, office and seniors housing. Our investment strategy consists of two primary components: (1) investing in Freddie Mac K-Series B-pieces, where in 2021 we were the fourth largest counterparty to Freddie Mac in the K-Series program; and (2) direct lending through the origination of floating rate first-mortgage loans, where we are a leader in the sub-$50 million direct lending market and a top issuer in the Commercial Real Estate CLO market. Freddie Mac K-Series B-pieces are subordinated tranche structured pass-through commercial mortgage-backed securities, which generally occupy a first-loss position for the underlying mortgage pool, which we believe offer an attractive risk-adjusted return in current and expected market conditions. Bridge’s locally based real estate teams and subsector expertise provide differentiated capabilities to assess the quality and risk of underlying collateral, including the ability to step in and manage assets as appropriate, and undertake differentiated due diligence of collateral in a manner that utilizes our knowledge of markets, market trends, assets, and the financial condition of owners/sponsors. These capabilities, coupled with the securitized finance, structuring, and capital markets expertise of our Debt Strategies team, provides this platform with a differentiated and enhanced approach to investing in the commercial real estate debt market while mitigating risk. As of December 31, 2021, our Debt Strategies platform had approximately $10.6 billion of AUM across multiple closed-end funds, related vehicles and separate accounts.
Agency MBS. Our Agency MBS investment platform invests in residential mortgage-backed securities, or Agency MBS, guaranteed by U.S. Government Sponsored Enterprises, or GSEs, in a proprietary structure designed to drive high cash returns with hedged interest rate and limited credit risk and to mitigate market dislocations and preserve principal. The GSEs’ guarantee of principal and interest mitigates underlying borrower credit risk in the Agency MBS market. Our investment process consists of a top-down analysis of market conditions and opportunities, a systematic asset selection and portfolio creation process, transaction negotiation and hedging execution, and ongoing risk review, portfolio management and reporting. Our investment strategy focuses on asset selection, leveraging our expertise in Agency MBS and our proprietary method of loan-level analysis in an effort to identify loans with relatively limited refinancing risk. We then utilize funding and interest rate hedging across the yield curve to mitigate the impact of changes in interest rates and to create stable cash flows. Our Agency MBS platform is led by a team with extensive experience managing Fannie Mae’s Agency MBS and Collateralized Mortgage Obligations prior to joining Bridge. As of December 31, 2021, our Agency MBS platform had approximately $1.8 billion of AUM in an open-end fund structure that is perpetually deploying capital.
Single-Family Rental. In the first quarter of 2022, we launched our Single-Family Rental investment platform with the acquisition of the operations of Gorelick Brothers Capital. Our investment strategy in this new platform focuses on the acquisition and operation of assets in the Single-Family Rental, or SFR, market. In connection with the launch of the strategy, we acquired a portfolio of over 2,700 SFR properties previously managed by Gorelick Brothers Capital, which are supported by a vertically integrated 70+ person SFR property management team that also joined Bridge in connection with the acquisition and launch of this platform. With approximately 14.5 million households in the single-family rental market in the U.S., and given the population of millennials that continue to face significant barriers to home ownership, coupled with housing supply shortages, we believe the SFR market presents significant opportunity today and in the future. Our “owner-operator” model allows us to manage assets internally, with in-house personnel performing functions such as property management, construction management and leasing.
Our Investment and Asset Management Process
Our investment process has been refined over our extensive history and we believe the process enables Bridge to generate attractive returns for investors while reducing risk. Our investment approach employs collaboration across all of our platforms, enabling Bridge to leverage local market knowledge and provide a holistic underwriting of each investment. For example, investment teams within each platform have access to local contacts that expand the potential opportunity set of investments and provide enhanced market knowledge and improved underwriting. Local contacts from one investment platform often generate incremental investment opportunities for another investment platform, frequently off-market, that are not available to investment firms lacking the vertical integrated platform spanning a range of investment platforms.
12
Our vertically integrated investment process begins with detailed market research, where we combine top-down sub-market analysis with our bottom-up local market expertise, to provide a unique relative value perspective across our target markets. We use a comprehensive, data-driven approach to analyze macroeconomic trends and identify compelling investment opportunities. Extensive underwriting and transactional experience helps us secure off-market investment opportunities and produces insights that enhance the quality and rigor of our underwriting. We use proprietary tools across all of our platforms that support underwriting new investments and are designed to increase the value of existing investments, through active asset management capabilities. Our property management and underwriting are inherently data-oriented, using inputs collected at the property level to identify and drive operational efficiencies and growth. Analytical metrics vary by platform and investment team, but typically include detailed supply and demand forecasts and market pricing, all at the local level, as well as operational metrics that help us understand past, current and prospective issues that may impact the performance of our assets. The hands-on experience of our operating platforms, together with our market analysis, has led to superior underwriting, alpha generation and leading investment returns. We believe that frequent involvement and input from the applicable investment committee along with an integrated review and analysis from our localized teams in each market provide a significant competitive advantage due to our vertically integrated structure.
Structure and Operation of Our Investment Vehicles
We primarily conduct the management of our funds and other vehicles through a partnership or limited liability structure (or similar structures for non-U.S. vehicles) where the entity organized by us accepts subscriptions or commitments for investment from institutional investors and high-net-worth individuals. Such commitments are generally drawn down from investors on an as-needed basis to fund investments or for other permitted purposes over a specified term. We also advise a number of investors through joint ventures, separately managed accounts, or single investor funds. In some cases, those vehicles are non-discretionary and we provide investment management services for vehicles controlled by the investors.
Substantially all of the day-to-day operations of each investment vehicle are typically carried out by a Bridge investment adviser subsidiary that is registered under the Investment Advisers Act of 1940, as amended, or the Advisers Act, pursuant to an investment advisory, investment management or other similar agreement. Generally, the material terms of our investment advisory agreements relate to the scope of services to be rendered by the investment adviser to the applicable vehicle, the calculation of management fees to be borne by investors in our investment vehicles, the calculation of and the manner and extent to which other fees received by the investment adviser from funds serve to offset or reduce the management fees payable by investors in our investment vehicles and certain rights of termination with respect to our investment advisory agreements. In addition to having an investment adviser, each investment vehicle that is a partnership (or similar structure for non-U.S. vehicles) also has a general partner that generally makes all operational and investment decisions, including making, monitoring and disposing of investments. The limited partners of our discretionary funds and other vehicles generally take no part in the conduct or control of the business of these vehicles, have no right or authority to act for or bind the vehicles and have no influence over the voting or disposition of the securities or other assets held by the vehicles. The governing agreements of many of our investment vehicles provide that in the event certain “key persons” managing a vehicle do not meet specified time commitments with regard to managing that or other Bridge affiliated vehicles, then investors may have the right to accelerate or terminate the investment period for that vehicle or have other remedies as set forth in the applicable governing agreements of that vehicle.
Our Fund Investors
Our global fund investor base is balanced across individual investors, which includes high-net-worth fund investors, fund investors who invest through a wirehouse relationship or through a Registered Investment Adviser, or RIA, family offices, and institutional investors, which includes public and private organizations who manage capital as fiduciaries on behalf of their investors or beneficiaries (e.g., public and private pension funds, sovereign wealth funds, insurance companies, endowments, foundations, and funds of funds). We view this balance in our fund investor base as a meaningful differentiator, and one that has enabled us to consistently grow our increasing breadth of managed vehicles and strategies. On the individual investor side, we have more than 10,000 fund investors globally, comprising approximately 68% of our committed capital as of December 31, 2021. On the institutional side, we have more than 180 fund investors spanning four continents, comprising approximately 32% of our committed capital as of December 31, 2021. We view these two distinct components of our fund investor base to be highly complementary and believe they provide us with significant opportunities for continued growth, stability, and diversification among our fund investor base. Our Client Solutions Group manages relationships with our distribution partners and our institutional fund investors in a high-touch capacity.
13
Individual Investors
We believe that real estate is an important investment allocation for individual/high-net-worth investors and as a result, early in our history we developed our capabilities in managing distribution and investor service customized to these investors. We have deep and broad individual investor relationships and capital raising capabilities which have been driven in part by our relationships with some of the largest wirehouses and RIAs in the world. Our managed vehicles are offered and distributed by four of the largest wirehouses in North America, which we believe is truly differentiated among private alternative asset managers, and which provides a growing fund investor base comprised of sticky and repeat clients. Over the past decade, we have developed our relationships with the leading wirehouses through our executive level involvement and a high-touch, high frequency approach to these relationships and through our collaborative involvement in investor education and coverage, which we believe makes us a preferred partner for the wirehouses. For example, our senior executives maintain frequent interaction with large financial advisor teams from our wirehouse distribution partners and RIAs and are highly collaborative and engaged in all aspects of investor education and investor management. Further, our diversified array of managed vehicles enables the wirehouses and RIAs to provide their clients with a range of potential investment alternatives enabling tailored exposure across real estate private investment strategies.
Our success with individual high-net-worth fund investors is evident through our serial development of focused vehicles. For example, in 2019 we launched Bridge Development, which was in part, designed to target the unique tax benefits of investing in QOZs and for which Bridge was particularly well-positioned given our multi-decade leadership in community revitalization. These tax benefits are very advantageous for individual/high-net-worth investors and by virtue of our deep relationships and capabilities across the wirehouse and RIA channels, as of December 31, 2021, we have raised an aggregate of approximately $3.5 billion of equity capital across four distinct development-focused vehicles, establishing Bridge as a leader in this segment of the market.
Our individual/high-net-worth investors in our equity strategies generally pay us investment management fees of between 1.5% and 2.5% and incentive fees of between 15% and 20% above a preferred return hurdle. On our debt strategies, our individual/high-net-worth investors generally pay us investment management fees of between 1.25% and 1.75% and incentive fees of 15% above a preferred return hurdle. We typically share a portion of the fees we earn on capital raised through wirehouse and RIA distribution channels.
Institutional Investors
Our institutional fund investor base includes some of the world’s largest public and private pension funds, sovereign wealth funds, and insurance companies, as well as banks, corporations, endowments, foundations, funds of funds and family offices. Our institutional fund investor relationships span North America, Europe, the Middle East and Asia and comprised approximately 32% of our committed capital as of December 31, 2021. Because we manage a range of sector specialized investment vehicles, we maintain a high-touch, high frequency approach to fund investor relationships. Our range of specialized product offerings and high-touch approach to fund investor coverage facilitates significant cross-selling among our institutional investor base. 58% of Bridge fund investors (including each wirehouse platform as a single investor) have invested in two or more funds, and 15% of our institutional investors have invested across three or more funds.
Our institutional investors in our equity strategies generally pay us investment management fees of between 1.0% and 1.5% and incentive fees of between 15% and 20% above a preferred return hurdle. On our debt strategies, our institutional investors generally pay us investment management fees of between 0.75% and 1.25% and incentive fees of 15% above a preferred return hurdle.
Capital Invested In and Alongside Our Investment Vehicles
To further align our interests with those of our fund investors, we have invested Bridge capital and that of our personnel and affiliates in the investment funds and other vehicles we sponsor and manage. Minimum general partner capital commitments to our investment vehicles are determined separately with respect to each vehicle. We determine whether to make general partner capital commitments to our funds and other vehicles in excess of the minimum required commitments based on, among other things, our anticipated liquidity, working capital and other capital needs. In many cases, we require our senior managing directors and other professionals and affiliates to personally fund a portion of the general partner capital commitments to our investment vehicles. In other cases, Bridge may make capital commitments directly. Our general partner capital commitments are generally funded with cash and not with carried interest or deferral of management fees. Bridge, Bridge personnel and certain relationships also have the opportunity to make investments in or alongside our funds and other vehicles we manage, in some instances without being subject to management fees, carried interest or incentive fees.
14
Human Capital Management
Employees
As of December 31, 2021, we had approximately 1,800 employees, including approximately 140 investment professionals and approximately 450 employees supporting our investment, investor service and corporate activities. Our remaining approximately 1,200 employees operate our properties and are generally expensed via our managed investment vehicles, as property level operating expenses for the assets owned by our managed investment vehicles. Additionally, we have approximately 2,450 professionals employed through a professional employment organization at sites managed by Bridge Senior Living, all of whom are expensed via our managed investment vehicles. None of our employees are represented by a labor union or are party to a collective bargaining agreement, and we have had no labor-related work stoppages. We believe that we have good relationships with our employees.
Corporate Culture
Bridge is committed to fostering, cultivating and strengthening a culture of diversity and inclusion. We believe that our human capital is our most valuable asset. The collective sum of the individual differences, life experiences, knowledge, inventiveness, innovation, self-expression, unique capabilities and talent that our employees invest in their work represents a significant part of not only our culture, but our reputation and commitment to excellence.
We uphold these principles through annual mandatory diversity awareness training and comprehensive employee handbooks designed to instruct and remind all Bridge employees that they have a responsibility to treat others with dignity, respect, and professionalism at all times, and are expected to exhibit conduct that reflects respectfulness and inclusion during work, at work functions on or off the work site, and at all other company- sponsored and participative events. We strongly encourage any employees who believe they have been subjected to any kind of discrimination or other incident that conflicts with our corporate culture to report such incidents to a supervisor or human resources representative. Any employee found to have exhibited any inappropriate conduct or behavior against others may be subject to disciplinary action, including termination.
Moreover, we are committed to building and maintaining a talented and diverse workforce that delivers strong performance and results to our stakeholders through a comprehensive and holistic approach to recruiting, developing and retaining our talent from all backgrounds, cultures and perspectives. We focus on enabling and supporting an environment of respect and trust that benefits all Bridge employees. In order to realize this collective commitment, we have set four overarching goals for our company culture, representing a structured approach to achieving and sustaining progress in promoting an inclusive work environment and providing opportunities for all employees to use their varied talents to support our mission and pursuit of excellence:
Talent Acquisition, Development and Retention
We believe the talent of our employees, coupled with our rigorous investment process, has supported our excellent investment record over many years. We are therefore focused on hiring, training, motivating and retaining talented individuals. Across all our businesses, we face intense competition for qualified personnel.
15
We seek to attract candidates from different backgrounds and skill sets and to hire the brightest minds in our industry. We believe our reputation, talent development opportunities, benefits and compensation make us an attractive employer. We encourage independent thinking and reward initiative while providing training and development opportunities to help our employees grow professionally. In addition, and as discussed more below, the establishment of our Diversity and Inclusion Committee and related initiatives help promote an inclusive work environment in which all individuals are treated with respect and dignity. Employee education and training are also critical to maintaining a culture of compliance. We seek to retain and incentivize the performance of our employees through our compensation structure and also enter into non-competition and non-solicitation agreements with certain employees. Compensation comprises salaries, bonus (including discretionary awards), related benefits, and share-based compensation. Bonus is accrued over the employment period to which it relates. We offer comprehensive benefit programs to our employees, including major medical, dental and vision benefits, life insurance coverage, healthcare related spending accounts, including flexible spending accounts or health savings accounts as applicable, paid time off, 401(k) retirement plan with a Company match, along with numerous other offers aimed at supporting our employees both personally and professionally. We recognize and support the growth and development of our employees and offer opportunities to participate in internal as well as external learning programs.
Incentive Fee Compensation
To further align the interests of our employees with our shareholders and to cultivate a strong sense of ownership and commitment to our Company, certain employees also are eligible to receive profits interests awards and performance allocations. Equity-classified awards granted to employees that have a service condition only are measured at fair value at date of grant and remeasured at fair value only upon a modification of the award. The fair value for profits interests awards classified as equity is determined using a Monte Carlo valuation on the grant date or date of remeasurement. These awards are fair valued using a discounted cash flow approach. We recognize compensation expense on a straight-line basis over the requisite service period of the awards not contingent on employment, with the amount of compensation expense recognized at the end of a reporting period at least equal to the fair value of the portion of the award that has vested through that date. Compensation expense is adjusted for actual forfeitures upon occurrence.
Performance Allocations Compensation
Performance fee-related compensation deemed to be liability awards represents the portion of performance allocation revenue and incentive fees that have been awarded to employees as a form of long-term incentive compensation. Performance fee-related compensation is generally tied to the investment performance of the funds. Up to 60% of performance allocation revenue is awarded to employees as part of our long-term incentive compensation plan, fostering alignment of interest with our fund investors and investors, and retaining key investment professionals. Carried interest-related compensation is accounted for as compensation expense in conjunction with the related performance allocation revenue and, until paid, is recorded as a component of accrued performance allocations compensation in the combined balance sheets. Amounts presented as realized indicate the amounts paid or payable to employees based on the receipt of performance allocation revenue from realized investment activity. Carried interest-related compensation expense may be subject to reversal to the extent that the related performance allocation revenue is reversed. Carried interest-related compensation paid to employees may be subject to clawback on an after-tax basis under certain scenarios. Incentive fee-related compensation is accrued as compensation expense when it is probable and estimable that payment will be made.
Diversity Commitment
We embrace and encourage our employees’ differences in age, color, disability, ethnicity, family or marital status, gender identity or expression, language, national origin, political affiliation, race, religion, sexual orientation, veteran status, and other characteristics that make our employees valuable as individuals. We implement diversity initiatives and considerations throughout our company, including, but not limited to, our practices and policies on recruitment and selection, compensation and benefits, professional development, training and mentoring, promotions and personnel actions, transfers, social and recreational programs, and the ongoing development of a work environment built on the premise of equality that encourages and enforces:
16
In 2020, we engaged a diversity, equity and inclusion, or DE&I, consulting firm to help us achieve these goals and implement DE&I-focused institutional frameworks into our overall corporate strategy. Key among these initiatives is ensuring that all employee voices are heard. To this end, we have established a DE&I Committee comprised of various managers and senior members of Bridge, as well as employee-led focus groups for diverse professionals. We have also established various employee resource groups to drive inclusion, educate and build awareness, and provide a platform to address and support the needs of diverse individuals, including the Bridge Women’s Network, Black Inclusion Group, Bridge Allies for AAPI, BIG Pride, Unidos @Bridge, Bridge Advocates for Accessibility and Bridge of Honor Veterans Group.
Environmental, Social and Governance, or ESG, Commitment
We are seeking to integrate and operationalize ESG across our operations to improve decision-making and risk management. This includes striving to implement best practices at all our corporate offices and at the properties owned by certain of our equity funds.
We are a signatory to the UNPRI along with 7,000 corporate signatories across 135 countries, which in 2020 recognized Bridge for our real-world impact in addressing the “missing middle” within the Bridge Workforce and Affordable Housing family of funds. Similarly, Bridge Workforce and Affordable Housing won ESG Private Equity Fund of the Year in the 2021 ESG Awards and “Social Fund of the Year” from Environmental Finance Sustainable Investment Awards. We are committed to incorporating ESG factors across our operational decision making where applicable and internal policies and believe we are a market leader with our detailed reporting and actionable intelligence, including the Global Impact Investor Network’s Impact Reporting Investment Standards, or IRIS, metrics we report across our Workforce and Affordable Housing investments and anticipate incorporating into our reporting for our Opportunity Zone investments. IRIS metrics provide us an opportunity to provide data to our fund investors that are designed to measure the impacts of the ESG initiatives we implement at our properties within our Workforce and Affordable Housing strategy. In our reporting of IRIS metrics, we believe we provide a level of actionable intelligence not often found in the private equity or real estate industries as to how our investment dollars drive economic and social mobility and revitalize communities within our Workforce and Affordable Housing strategy. We report granularly at the asset level on metrics across a multitude of pillars, many of which are aligned with the UN Sustainable Development Goals, including, but not limited to affordability, environmental sustainability, social and economic mobility, and diversity, equity and inclusion.
We have undertaken multiple initiatives around diversity and inclusion, energy conservation and community engagement including, as an example, our Bridge Community Enhancement Initiative, or BCEI, in our Workforce and Affordable Housing platform. Through BCEI, we have committed to forgo a portion of our management fee equal to 25 basis points of committed or invested capital, as applicable, in the Bridge Workforce and Affordable Housing funds to be redirected and used to amplify social and community programming at the assets of those funds. We also created the Bridge CARES: COVID-19 Relief Fund, with one relief fund in 2020 and another in 2021, to provide financial support to thousands of qualifying residents of communities owned by our Workforce and Affordable Housing funds. We are also developing an innovative solar power program that we launched in 2021, beginning with the installation of our initial solar photovoltaic site at one of our office assets and others planned or being explored at certain office and multifamily assets. Additionally, we were among the first businesses to participate in Freddie Mac’s Green Advantage program, and through our Bridge Green Initiatives program, we are committed to being a leader in environmental stewardship and conservancy at our assets and in our communities. Our other initiatives include our Bridge to Education program (providing scholarship grants for residents of Bridge-managed multifamily communities).
COVID-19 Safety
We are committed to providing a safe environment for all of our employees as well as residents and tenants of our properties, which has become more important than ever in light of the COVID-19 pandemic. We have adopted comprehensive health and safety protocols and recommendations issued by the U.S. Centers for Disease Control and Prevention and state and local health officials. Employees are notified of these protocols and recommendations and regularly reminded of the importance of adhering to them for the safety and protection of themselves, their Bridge colleagues and partners, and the thousands of residents and tenants at properties that we own and/or manage. Our COVID-19 prevention measures include, among other things: (i) social distancing protocols and mask policies; (ii) increased cleaning of surfaces, floors, and common areas throughout our corporate offices and properties; (iii) regular contact tracing of confirmed positive COVID-19 tests and potential exposures; (iv) facilitating and encouraging remote working arrangements where necessary to the extent practicable. We continue to closely monitor developments in the pandemic and efforts to control and prevent its spread and have updated and will continue to update our protocols and policies on an ongoing basis in accordance with the recommendations and guidelines of health officials and experts.
17
Competition
We compete in all aspects of our business with a large number of asset management firms, commercial banks, broker-dealers, insurance companies and other financial institutions. With respect to our funds, we primarily compete in the U.S. real estate equity and debt sectors with the alternative asset management businesses of a number of large international financial institutions and established local and regional competitors based in the United States, Europe and Asia, including managers offering funds-of-funds, secondary funds and direct/co-investment funds in the private markets.
In order to grow our business, we must maintain our existing fund investor base and attract additional investors for our funds. Historically, we have competed principally on the basis of the factors listed below:
The asset management business, including in the U.S. real estate space in which we operate, is intensely competitive, and in addition to the above factors, our ability to continue to compete effectively and grow our business will depend upon our ability to attract highly qualified investment professionals and retain existing employees. See “Risk Factors—Risks Related to Our Industry—The investment management business is intensely competitive” for further details.
Regulatory and Compliance
Our business is subject to extensive federal and state regulation in the United States. Under these laws and regulations, the SEC and relevant state securities authorities have broad administrative powers, including the power to limit, restrict or prohibit an investment adviser from carrying on its business if it fails to comply with such laws and regulations. Possible sanctions that may be imposed include the suspension of individual employees, limitations on engaging in certain lines of business for specified periods of time, revocation of investment adviser and other registrations, censures and fines. We are also subject to regulatory oversight and requirements in several foreign jurisdictions in which we operate or where interests in our funds are offered.
SEC Regulation
Certain of our consolidated subsidiaries are registered as investment advisers with the SEC. Registered investment advisers are subject to the requirements of the Investment Advisers Act, and the rules promulgated thereunder, as well as to examination by the SEC’s staff. The Investment Advisers Act imposes substantive regulation on virtually every aspect of our business and our fund investor relationships. Applicable requirements may relate to, among other things, fiduciary duties to fund investors, engaging in transactions with fund investors, maintaining an effective compliance program, performance fees, solicitation arrangements, allocation of investments, conflicts of interest, marketing, recordkeeping, reporting and disclosure requirements. These requirements are evolving, and the SEC has recently proposed an additional slate of rules that, if enacted, would apply to our investment adviser subsidiaries and our investment management business. The Investment Advisers Act also regulates the assignment of advisory contracts by the investment adviser. The SEC is authorized to institute proceedings and impose sanctions for violations of the Investment Advisers Act, ranging from fines and censures to termination of an investment adviser’s registration. Failure to comply with the requirements of the Investment Advisers Act or the rules and regulations promulgated by the SEC could have a material adverse effect on our business.
Our funds are not registered under the 1940 Act, because we primarily only offer interests in our funds to persons who we reasonably believe to be “qualified purchasers,” as defined in the 1940 Act, or rely on other exemptions from registration under the 1940 Act.
18
ERISA-Related Regulation
Some of our funds include “benefit plan investors,” as defined under the Employee Retirement Income Security Act of 1974, as amended, or ERISA. Without a statutory or administrative exemption, we would be considered a “plan fiduciary” under ERISA with respect to such benefit plan investors by virtue of our role as investment manager of these funds. ERISA and the Code impose certain duties on persons that are plan fiduciaries under ERISA, prohibiting certain transactions involving benefit plans and “parties in interest” or “disqualified persons” to those plans, and providing for monetary penalties against plan fiduciaries for violations of these prohibitions. In order for our funds’ investments to not constitute “plan assets” under ERISA for the purposes of the fiduciary responsibility obligations thereunder, we rely on particular exemptions related to the manner in which we structure investments from benefit plan investors and in how we conduct certain investment management activities. Maintaining these exemptions may be highly complex and may in certain circumstances depend on compliance by third parties whom we do not control. Our failure to comply with these various requirements could subject us to regulatory action or third-party claims which could have a material adverse effect on our business.
Foreign Regulation
We provide investment advisory and other services and raise funds in a number of countries and jurisdictions outside the United States. In a number of these countries and jurisdictions, which include the UK, EU, the EEA, and certain of the individual member states of each of the EU and EEA, South Korea, the Cayman Islands and Canada, our operations, and in some cases our personnel, are subject to regulatory oversight and affirmative requirements. These requirements variously relate to registration, licenses, periodic inspections, the provision and filing of periodic reports, and obtaining certifications and other approvals. Across the EU, we are subject to the AIFMD requirements regarding, among other things, registration for marketing activities, the structure of remuneration for certain of our personnel and reporting obligations. Individual member states of the EU have imposed additional requirements that may include internal arrangements with respect to risk management, liquidity risks, asset valuations, and the establishment and security of depository and custodial requirements. In certain other jurisdictions, we are subject to various securities and other laws relating to fundraising and other matters. Failure to maintain compliance with applicable laws and regulations could result in regulatory intervention, adversely affect our business or ability to provide services to our fund investors and harm our reputation.
It is expected that additional laws and regulations will come into force in the UK, the EEA, the EU, and other countries in which we operate over the coming years. In addition, there may be changes to the AIFMD regime and also further regulation adopted which may impact those parts of our business operating within the EU.
There have also been significant legislative developments affecting the private equity industry in Europe and there continues to be discussion regarding enhancing governmental scrutiny and/or increasing regulation of the private equity industry.
With the expiration of the Brexit transition period on December 31, 2020, UK regulated entities lost the right to passport their services to EEA countries, and EEA entities lost the right to reciprocal passporting into the UK (subject to a transitional regime). Further, the UK’s departure from the EU and the potential resulting divergence between the UK and EU regulatory frameworks may result in additional complexity and costs in complying with regulations across both the UK and EU.
Available Information
Bridge Investment Group Holdings Inc. is a Delaware corporation. We file annual, quarterly and current reports and other information with the SEC. These filings are available to the public at the SEC’s website at www.sec.gov. We make available free of charge on our website our annual reports on Form 10-K, quarterly reports on Form 10-Q, current reports on Form 8-K, and amendments to those reports filed or furnished pursuant to Section 13(a) or 15(d) of the Exchange Act, as soon as reasonably practicable after we electronically file such material with, or furnish it to, the SEC.
Website and Social Media Disclosures
Our principal internet address is www.bridgeig.com. We may use our investor relations website, Facebook page (www.facebook.com/BridgeIG), Twitter (www.twitter.com/BridgeInvGrp), and LinkedIn (www.linkedin.com/company/bridge-investment-group-holdings/mycompany/) accounts as channels of distribution of company information. The information we post through these channels may be deemed material. Accordingly, investors should monitor these channels, in addition to following our press releases, SEC filings and public conference calls. In addition, you may automatically receive email alerts and other information about Bridge when you enroll your email address by visiting the “Contact Us/Email Alerts” section of our website at https://ir.bridgeig.com. The contents of our website, any alerts and social media channels are not incorporated herein by reference and are not a part of this report. Information relating to our corporate governance is also included on our investor relations website.
19
Item 1A. Risk Factors
Investing in our Class A common stock involves a high degree of risk. You should carefully consider the risks and uncertainties described below, together with all of the other information in this annual report on Form 10-K, including our Consolidated and Combined Financial Statements and the related Notes, before deciding to invest in our Class A common stock. The occurrence of any of the events described below could harm our business, operating results and financial condition. In such an event, the market price of our Class A common stock could decline, and you may lose all or part of your investment. Additional risks and uncertainties not presently known to us or that we currently deem immaterial may also impair our business. See “Cautionary Note Regarding Forward-Looking Statements.”
Risks Related to Our Business
The historical performance of our fund investments may not be indicative of the future results of our fund investments or our operations or any returns expected on an investment in our Class A common stock.
Past performance of our funds and fund investments is not necessarily indicative of future results or of the performance of our Class A common stock. An investment in our Class A common stock is not an investment in any of our funds or other investments. In addition, the historical and potential future returns of funds or other investments that we manage are not directly linked to returns on our Class A common stock. Therefore, you should not conclude that continued positive performance of our funds or other investments will necessarily result in positive returns on an investment in our Class A common stock. However, poor performance of our funds or other investments could cause a decline in our revenue and could therefore have a negative effect on our performance and on returns on an investment in our Class A common stock.
The historical performance of our funds and other investments should not be considered indicative of the future performance of these funds or of any future funds we may raise, in part because:
The substantial growth of our business in recent years may be difficult to sustain, as it may place significant demands on our resources and employees and may increase our expenses in the future.
The substantial growth of our business has placed, and if it continues, will continue to place, significant demands on our infrastructure, our investment team and other employees, and will increase our expenses. In addition, we are required to develop continuously our infrastructure in response to the increasingly complex investment management industry and increasing sophistication of investors. Legal and regulatory developments also contribute to the level of our expenses. The future growth of our business will depend, among other things, on our ability to maintain the appropriate infrastructure and staffing levels to sufficiently address our growth and may require us to incur significant additional expenses and commit additional senior management and operational resources. We may face significant challenges in maintaining adequate financial and operational controls as well as implementing new or updated information and financial systems and procedures. Training, managing and appropriately sizing our work force and other components of our business on a timely and cost-effective basis may also pose challenges. In addition, our efforts to retain or attract qualified investment professionals may result in significant additional expenses. There can be no assurance that we will be able to manage our growing business effectively or that we will be able to continue to grow, and any failure to do so could adversely affect our ability to generate revenue and control our expenses.
20
Valuation methodologies for certain assets held by our funds and other vehicles can be subject to significant subjectivity, and the values of assets may not be the same when realized.
The investments of our funds are generally illiquid and thus have no readily ascertainable market prices. We value these investments based on our estimate, or an independent third-party’s estimate, of their fair value as of the date of determination, which often involves significant subjectivity. There is no single standard for determining fair value in good faith and in many cases fair value is best expressed as a range of fair values from which a single estimate may be derived. We estimate the fair value of our investments based on third-party models, or models developed by us, which include discounted cash flow analyses and other techniques and may be based, at least in part, on independently sourced market parameters. The material estimates and assumptions used in these models include the timing and expected amount of cash flows, the appropriateness of discount rates used, and, in some cases, the ability to execute, the timing of and the estimated proceeds from expected financings, some or all of which factors may be ascribed more or less weight in light of the particular circumstances. The actual results related to any particular investment often vary materially as a result of the inaccuracy of these estimates and assumptions.
We include the fair value of illiquid assets in the calculations of net asset values, returns of our funds and our assets under management. Furthermore, we recognize performance fees from affiliates based in part on these estimated fair values. Because these valuations are inherently uncertain, they may fluctuate greatly from period to period. Also, they may vary greatly from the prices that would be obtained if the assets were to be liquidated on the date of the valuation and often do vary greatly from the prices we eventually realize; as a result, there can be no assurance that such unrealized valuations will be fully or timely realized.
If we realize value on an investment that is significantly lower than the value at which it was reflected in prior valuations, we could suffer losses in the applicable fund. This could in turn lead to a decline in asset management fees for certain vehicles and a loss equal to the portion of the performance fees from affiliates reported in prior periods that was not realized upon disposition. These effects could become applicable to a large number of our investments if our estimates and assumptions used in estimating their fair values differ from future valuations due to market developments. If asset values turn out to be materially different than values reflected in fund net asset values, fund investors could lose confidence which could, in turn, result in difficulties in raising additional capital.
If the investments we make on behalf of our funds perform poorly, we may suffer a decline in our investment management revenue and earnings, and our ability to raise capital for future funds may be materially and adversely affected.
Our revenue is derived from fees earned for our management of our funds and incentive fees or carried interest, among other sources. In the event that our funds or individual investments perform poorly, our revenues and earnings derived from incentive fees will decline and make it more difficult for us to raise capital for new funds or gain new fund investors in the future. For certain products or strategies, failure to integrate and apply acceptable ESG standards, carbon neutrality or climate change strategies, or sustainability or responsible investment principles, can be considered in determining, or result in, poor performance, and result in decreased capital commitments and increased redemptions, and failure to earn performance fees, carried interest and/or other fees. In addition, if carried interest that was previously distributed to us exceeds the amounts to which we are ultimately entitled, we may be required to repay that amount under a “clawback” obligation pursuant to the governing documents of our funds. These clawback obligations may require us to use cash or other reserves to satisfy such obligations instead of using the cash for another purpose. If we are unable to raise or are required to repay capital, our business, financial condition and results of operations would be materially and adversely affected.
Additionally, certain of our strategies are designed to permit fund investors to be eligible to obtain certain tax benefits through their investment in the funds within these strategies. For example, our Opportunity Zone funds are organized to be “qualified opportunity funds” as defined in Section 1400Z-2(d) of the Code. Although our Opportunity Zone funds do not guarantee eligibility for tax benefits available to investors in “qualified opportunity funds,” if these fund investors lose or otherwise become ineligible for some or all of the tax benefits available to investors in a “qualified opportunity fund,” that could negatively impact our ability to attract new capital for our opportunity zone and other funds, which could have a negative impact on our management fees.
Our revenues are subject to the risks inherent in the ownership and operation of real estate and the construction and development of real estate, including, among other risks, environmental liabilities.
Real property investments are subject to varying degrees of risk. These risks include changes in general or local economic conditions, interest rates, availability of mortgage funds, real estate taxes and other operating expenses, environmental changes, availability of insurance, and acts of God (which may result in uninsured losses).
21
Our funds are subject to risks arising from the ownership and operation of real estate and real estate-related businesses and assets. In addition to the general risks described above, these risks include the following: general and local economic conditions; changes in supply of and demand for competing properties in an area (as a result, for example, of overbuilding); changes in building, environmental and other laws (including regulations related to climate change); diminished financial resources of tenants; energy and supply shortages; uninsured or uninsurable risks; liability for “slip-and-fall” and other accidents on properties held by our funds; natural disasters; changes in government regulations (such as rent control and tax laws); changes in real property tax and transfer tax rates; changes in interest rates; the reduced availability of mortgage funds which may render the sale or refinancing of properties difficult or impracticable; negative developments in the economy that depress travel activity; environmental liabilities, including under environmental laws that impose, regardless of fault, joint and several liability for the cost of remediating contamination and compensation for damages; contingent liabilities on disposition of assets; unexpected cost overruns in connection with development projects; terrorist attacks, war (including current hostilities between Russia and Ukraine) and other factors that are beyond our control; and dependence on operating partners. Even in cases where we are indemnified against liabilities, we cannot assure you as to the financial viability of the indemnifying party to satisfy such indemnities or our ability to achieve enforcement of such indemnities.
If our funds or fund investors acquire direct or indirect interests in undeveloped land or underdeveloped real property, which may often be non-income producing, they will be subject to the risks normally associated with such assets and development activities, including risks relating to the availability and timely receipt of zoning and other regulatory or environmental approvals, the cost and timely completion of construction (including risks beyond the control of our fund, such as weather or labor conditions or material shortages) and the availability of both construction and permanent financing on favorable terms. Additionally, such investments may be managed by a third-party, which makes them dependent upon such third parties. Any of these factors may cause the value of real estate investments to decline, which may have a material adverse effect on our funds or our business, financial condition and results of operations.
Investors in our open-end funds may redeem their investments in these funds on short notice, which could lead to a decrease in our investment management revenue and earnings.
Investors in our open-end funds may redeem their investments following the expiration of a specified period of time, subject to the applicable fund’s specific redemption provisions. Redemptions from these open-end funds would decrease the management fee payable to us from these investors. In a declining market, these open-end funds may experience declines in value and the pace of redemptions and consequent reduction in management fees payable to us could accelerate. To the extent permissible under our fund’s governing documents, we may suspend redemptions during a redemption period, which could adversely impact our reputation.
The success of our business depends on the identification and availability of suitable investment opportunities for our funds.
Our success largely depends on the identification and availability of suitable investment opportunities for our funds. The availability of investment opportunities will be subject to market conditions and other factors outside of our control. The historical investment returns of our funds have benefited from investment opportunities and general market conditions that may not continue or reoccur, including favorable borrowing conditions in the debt markets, and we cannot assure you that our funds will be able to avail themselves of comparable opportunities and conditions.
Difficult economic, market and political conditions may adversely affect our businesses, including by reducing the value or hampering the performance of the investments made by our funds or reducing the ability of our funds to raise or deploy capital, each of which could materially reduce our revenue, earnings and cash flow and adversely affect our financial prospects and condition.
Our investments are materially affected by conditions in the global financial markets and economic and political conditions throughout the world, such as interest rates, the availability and cost of credit, inflation rates, economic uncertainty, changes in laws or regulations (including laws relating to our taxation, taxation of our fund investors and the possibility of changes to regulations applicable to alternative asset managers), trade policies, commodity prices, tariffs, currency exchange rates and controls and national and international political circumstances (including wars and other forms of conflict, terrorist acts, and security operations) and catastrophic events such as fires, floods, earthquakes, tornadoes, hurricanes, other adverse weather and climate conditions and pandemics. These factors are outside of our control and may affect the level and volatility of securities prices and the liquidity and value of investments, and we may not be able to or may choose not to manage our exposure to these conditions.
22
Global financial markets have experienced heightened volatility in recent periods, including as a result of economic and political events in or affecting the world’s major economies. For example, the withdrawal of the U.K. from the EU in January 2020 and subsequent ongoing uncertainty regarding the future relationship between the U.K. and the EU following the end of the Brexit transition period on December 31, 2020, hostilities in the Middle East region, the conflict between Russia and Ukraine, and concerns over increasing inflation and deflation, as well as interest rate volatility and fluctuations in oil and gas prices resulting from global production and demand levels, have precipitated market volatility.
In addition, numerous structural dynamics and persistent market trends have exacerbated volatility generally. Concerns over significant declines in the commodities markets, sluggish economic expansion in non-U.S. economies, including continued concerns over growth prospects in China and emerging markets, and growing debt loads for certain countries all highlight the fact that economic conditions remain unpredictable and volatile. In recent periods, trade tensions between the U.S. and China, and other geopolitical tensions, including those between Russia and Ukraine, have escalated. Further escalation of such tensions and the related imposition of sanctions or other trade barriers may negatively impact the rate of global growth. Moreover, there is a risk of both sector-specific and broad-based corrections and/or downturns in the equity and credit markets. Any of the foregoing could have a significant impact on the markets in which we operate and a material adverse impact on our business prospects and financial condition.
A number of factors have had and may continue to have an adverse impact on credit markets in particular. In addition, the Federal Reserve is widely expected to increase the federal funds rate in 2022. Changes in and uncertainty surrounding interest rates may have a material effect on our business, particularly with respect to the cost and availability of financing for acquisition and disposition transactions.
These and other conditions in the global financial markets and the global economy may result in adverse consequences for us and many of our funds, each of which could adversely affect the investments of such funds, restrict such funds’ investment activities, impede such funds’ ability to effectively achieve their investment objectives and result in lower returns than we anticipated at the time certain of our investments were made. More specifically, these economic conditions could adversely affect our operating results by causing: decreases in the market value of securities, debt instruments or investments held by some of our funds; illiquidity in the market, which could adversely affect transaction volumes and the pace of realization of our funds’ investments or otherwise restrict the ability of our funds to realize value from their investments, thereby adversely affecting our ability to generate performance fees or other income; our assets under management to decrease, thereby lowering a portion of our management fees payable by our funds to the extent they are based on market values; and increases in costs or reduced availability of financial instruments that finance our funds. During periods of difficult market conditions or slowdowns, negative financial results may reduce the net asset value of our funds and the investment returns for our funds, which could have a material adverse effect on our operating results and cash flow. Our funds may be adversely affected by reduced opportunities to exit and realize value from their investments, by lower-than-expected returns on investments made prior to the deterioration of the credit markets and by our inability to find suitable investments for the funds to effectively deploy capital, which could adversely affect our ability to raise new funds and thus adversely impact our prospects for future growth.
We have obligations to investors in our funds and may have obligations to other third parties that may conflict with your interests.
Our subsidiaries that serve as the general partners of or advisors to our funds have fiduciary and contractual obligations to the investors in those funds and accounts, and some of our subsidiaries may have contractual duties to other third parties. As a result, we may take actions with respect to the allocation of investments among our funds (including funds and accounts that have different fee structures), the purchase or sale of investments in our funds, the structuring of investment transactions for those funds, the advice we provide or other actions in order to comply with these fiduciary and contractual obligations, and such actions may conflict with your interests.
Our ability to retain our senior leadership team and attract additional qualified investment professionals is critical to our success.
Our success depends on our ability to retain our senior leadership team and to recruit additional qualified investment and other professionals. However, we may not be successful in our efforts to retain our senior leadership team, as the market for investment professionals is extremely competitive. The individuals that comprise our senior leadership team possess substantial experience and expertise and, in many cases, have significant relationships. Accordingly, the loss of any one of our senior leadership team could adversely affect certain relationships or limit our ability to successfully execute our investment strategies, which, in turn, could have a material adverse effect on our business, financial condition and results of operations.
23
Effective succession planning is also important to our long-term success. For example, Chad Briggs, our Chief Financial Officer, has notified us of his intent to retire from the Company, effective May 31, 2022. Upon the effective date of his retirement, Mr. Briggs will be succeeded by Katherine Elsnab, who currently serves as our Chief Accounting Officer. Failure to ensure effective transfer of knowledge and smooth transitions involving executives and other key employees could hinder our strategic planning, execution and future performance. Further, changes in our management team may be disruptive to our business, and any failure to successfully integrate key new hires or promoted employees could adversely affect our business, financial condition and results of operations.
We intend to expand our business and may enter into new investment asset classes, new lines of business and/or new markets, which may result in additional risks and uncertainties in our business.
We have grown and may continue to grow our business by offering additional products and services and by entering into new investment asset classes, new lines of business and/or new markets. In connection with this growth, we face numerous risks and uncertainties, including risks associated with the possibility that we have insufficient expertise to engage in such activities profitably or without incurring inappropriate amounts of risk, the required investment of capital and other resources and the loss of fund investors due to the perception that we are no longer focusing on our core business. In addition, we have pursued and may continue to, from time to time, pursue opportunities to grow our business via acquisitions, partnerships, investments or other strategic transactions. For example, in the first quarter of 2022, we launched our Single-Family Rental investment platform with the acquisition of the operations of Gorelick Brothers Capital. Our investment strategy in this new platform focuses on the acquisition and operation of assets in the Single-Family Rental market. There can be no assurance that we will successfully identify, negotiate or complete any additional of such transactions, or that any completed transactions, including the acquisition of the operations of Gorelick Brothers Capital, will produce favorable financial results.
Entry into certain lines of business may subject us to new laws and regulations with which we are not familiar, or from which we are currently exempt, and may lead to increased litigation and regulatory risk. In addition, certain aspects of our cost structure, such as costs for compensation, office space and communication and information technology services will be largely fixed, and we may not be able to timely adjust these costs to match fluctuations in revenue related to growing our business or entering into new lines of business. If a new business generates insufficient revenue or if we are unable to efficiently manage our expanded operations, our business, financial condition and results of operations could be materially and adversely affected.
Defaults by investors in our funds could adversely affect that fund’s operations and performance.
Our business is exposed to the risk that fund investors that owe us money may not pay us. If investors in our funds default on their obligations to us, there may be adverse consequences on the investment process, and we could incur losses. For example, investors in most of our funds make capital commitments to those funds that we are entitled to call from those fund investors at any time during prescribed periods. We depend on fund investors fulfilling and honoring their commitments when we call capital from them for those funds to consummate investments and otherwise pay their obligations when due. Any fund investor that did not fund a capital call would be subject to several possible penalties, however, those penalties may not be adequate to make us and the applicable fund whole. A failure of fund investors to honor a significant amount of capital calls for any particular fund or funds could have a material adverse effect on the operation and performance of those funds.
The COVID-19 pandemic has caused severe disruptions in the U.S. and global economy, may affect the investment returns of our funds, has disrupted, and may continue to disrupt, industries in which we and our funds operate and could potentially negatively impact us or our funds.
Over the past two years, the COVID-19 pandemic has resulted in a global and national health crisis, adversely impacted global commercial activity and contributed to significant volatility in equity and debt markets. Federal, state and local governments and private entities in impacted regions have taken, and may continue to take, actions in an effort to slow the spread of COVID-19 and variants of the virus. Such preventative measures have caused, and may continue to cause, business shutdowns, cancellations of events and restrictions on travel, significant reductions in demand for certain goods and services, reductions in certain business activity, supply chain interruptions and overall economic and financial market instability both globally and in the United States.
While global economic pressures related to the COVID-19 pandemic have moderated, the pandemic continues to create economic uncertainty which may lead to negative future impacts to the global economy, cause fluctuations in equity market valuations, decrease liquidity in fixed income markets, or create volatility and disruption in financial markets. Any such impacts may lead to renewed outsized demands on our transaction processing capabilities in our asset servicing business and volatility in our foreign exchange and asset management businesses.
24
The extent of the impact of the COVID-19 pandemic (including the restrictive measures taken in response thereto) on our and our funds’ operational and financial performance depends on many factors, including the duration, severity and scope of the actions taken by governmental authorities to contain its financial and economic impact (including, but not limited to, eviction moratoria or rent-control measures at the federal, state and local level), the long-term efficacy, availability and acceptance of COVID-19 vaccines, the continued or renewed implementation of travel advisories and restrictions, the impact of such actions on overall supply and demand, goods and services, investor liquidity, consumer confidence and levels of economic activity and the extent of its disruption to global, regional and local supply chains and economic markets, all of which are uncertain and difficult to assess.
Any public health emergency, including the COVID-19 pandemic and its variants or any outbreak of other existing or new epidemic diseases, or the threat thereof, and the resulting financial and economic market uncertainty could have a material adverse impact on us, the fair value of our and our funds’ investments and could adversely impact our funds’ ability to fulfill our investment objectives.
Our funds may experience a slowdown in the pace of their fundraising activity, investment activity and capital deployment, which could also adversely affect the timing of raising capital for new or successor funds and could also impact the management fees we earn on funds that generate fees based on invested (and not committed) capital. While the increased volatility in the financial markets caused by the COVID-19 pandemic may present attractive investment opportunities for certain investment strategies, we or our funds may not be able to complete those investments due to, among other factors, increased competition or operational challenges, such as our ability to raise capital within each strategy, obtain attractive financing, conduct due diligence and consummate the acquisition and disposition of investments for our funds.
The COVID-19 pandemic may adversely impact our business and operations since an extended period of remote working by our employees could strain our technology resources and introduce operational risks, including heightened cybersecurity risk. While we have taken steps to secure our networks and systems, remote working environments may be less secure and more susceptible to hacking attacks, including phishing and social engineering attempts that seek to exploit the COVID-19 pandemic. Further, local COVID-19-related laws can be subject to rapid change depending on public health developments, which can lead to confusion and make compliance with laws uncertain and subject us or our funds to increased risk of litigation for non-compliance.
Fund investors may be unwilling to commit new capital to our funds or advisory accounts as a result of our decision to become a public company, which could materially and adversely affect our business, financial condition and results of operations.
We became a publicly traded company upon the completion of our initial public offering in July 2021. Some of our fund investors may have concerns with our decision to become a publicly traded company, including concerns that as a public company we have shifted or will shift our focus from the interests of our fund investors to those of our public stockholders. Some of our fund investors may believe that we may strive to generate near-term profit for the public company rather than returns for our fund investors over time, or that we might grow our AUM for the purpose of generating additional management fees without regard to whether we believe there are sufficient investment opportunities to effectively deploy the additional capital. There can be no assurance that we will be successful in our efforts to address such concerns or to convince current or future fund investors that becoming a publicly traded company has not or will not negatively affect our longstanding priorities or the way we conduct our business. A decision by a significant number of our current fund investors or prospective future fund investors not to commit additional capital to our funds or to cease doing business with us altogether could inhibit our ability to achieve our investment objectives and may materially and adversely affect our business, financial condition and results of operations.
Our funds may face risks relating to undiversified investments.
We cannot give assurance as to the degree of diversification that will be achieved in any of our funds. Difficult market conditions or slowdowns affecting a particular asset class, geographic region or other category of investment could have a significant adverse impact on a given fund if its investments are concentrated in that area, which would result in lower investment returns. Accordingly, a lack of diversification on the part of a fund could adversely affect its investment performance and, as a result, our business, financial condition and results of operations.
25
We may not be able to maintain our desired fee structure as a result of industry pressure from private markets investors to reduce fees, which could have a material adverse effect on our profit margins and results of operations.
We may not be able to maintain our current funds’ fee structures as a result of industry pressure from private markets investors to reduce fees. In order to maintain our desired fee structure in a competitive environment, we must be able to continue to provide fund investors with investment returns and service that incentivize our fund investors to pay our desired fee rates. We cannot assure you that we will succeed in providing investment returns and service that will allow us to maintain our desired fee structure. Fee reductions on existing or future new business could have a material adverse effect on our profit margins and results of operations.
Our risk management strategies and procedures may leave us exposed to unidentified or unanticipated risks.
Risk management applies to our investment management operations as well as to the investments we make for our funds. We have developed and continue to update strategies and procedures specific to our business for managing risks, which include market risk, liquidity risk, operational risk and reputational risk. Management of these risks can be very complex. These strategies and procedures may fail under some circumstances, particularly if we are confronted with risks that we have underestimated or not identified. In addition, some of our methods for managing the risks related to our funds’ investments are based upon our analysis of historical private markets behavior. Statistical techniques are applied to these observations in order to arrive at quantifications of some of our risk exposures. Historical analysis of private markets returns requires reliance on valuations performed by Fund Managers, which may not be reliable measures of current valuations. These statistical methods may not accurately quantify our risk exposure if circumstances arise that were not observed in our historical data. In particular, as we enter new lines of business, our historical data may be incomplete. Failure of our risk management techniques could materially and adversely affect our business, financial condition and results of operations, including our right to receive incentive fees.
The due diligence process that we undertake in connection with investments may not reveal all facts that may be relevant in connection with an investment.
Before making or recommending investments for our fund investors, we conduct due diligence that we deem reasonable and appropriate based on the facts and circumstances applicable to each investment. When conducting due diligence, we may be required to evaluate important and complex business, financial, tax, accounting, environmental and legal issues. Outside consultants, legal advisors and accountants may be involved in the due diligence process in varying degrees depending on the type of investment and the parties involved. Nevertheless, when conducting due diligence and making an assessment regarding an investment, we rely on the resources available to us, including information provided by the target of the investment and, in some circumstances, third-party investigations. The due diligence investigation that we will carry out with respect to any investment opportunity may not reveal or highlight all relevant facts that are necessary or helpful in evaluating such investment opportunity. Moreover, such an investigation will not necessarily result in the investment ultimately being successful. Poor investment performance could result in negative reputational effects, which could materially and adversely affect our business, financial condition and results of operations.
Operational risks may disrupt our business, result in losses or limit our growth.
We rely heavily on our financial, accounting, compliance, monitoring, reporting and other data processing systems. Any failure or interruption of these systems, including the loss of data, whether caused by fire, other natural disaster, power or telecommunications failure, computer viruses, act of terrorism or war or otherwise, could result in a disruption of our business, liability to our funds, regulatory intervention or reputational damage, and thus materially and adversely affect our business. Although we have back-up systems in place, including back-up data storage, our back-up procedures and capabilities in the event of a failure or interruption may not be adequate. In recent years, we have substantially upgraded and expanded the capabilities of our data processing systems and other operating technology, and we expect that we will need to continue to upgrade and expand these capabilities in the future to avoid disruption of, or constraints on, our operations. We may incur significant costs to further upgrade our data processing systems and other operating technology in the future. In addition, we are dependent on the effectiveness of our information security policies, procedures and capabilities to protect our computer and telecommunications systems and the data such systems contain or transmit. As described in the following risk factor, breaches in security may also disrupt our business, result in losses or limit our growth.
26
Cybersecurity risks and data security breaches could result in the loss of data, interruptions in our business and damage to our reputation, and subject us to regulatory actions, increased costs and financial losses.
Our operations are highly dependent on our information systems and technology, and (as noted above) we rely heavily on our financial, accounting, communications and other data processing systems. Our or IT vendors’ systems may fail to operate properly or become disabled as a result of tampering or a breach of our network security systems. In addition, our systems face ongoing cybersecurity threats and attacks. Breaches in security, whether malicious in nature or through inadvertent transmittal or other loss of data, could potentially jeopardize our, our employees’ or our fund investors’ or counterparties’ confidential, proprietary and other information processed and stored in, and transmitted through, our computer systems and networks, or otherwise cause interruptions or malfunctions in our, our employees’, our fund investors’, our counterparties’ or third parties’ business and operations, which could result in significant financial losses, increased costs, liability to our fund investors and other counterparties, regulatory intervention and reputational damage.
Attacks on our systems could involve, and in some instances have in the past involved, attempts intended to obtain unauthorized access to our proprietary information, destroy data or disable, degrade or sabotage our systems, or divert or otherwise steal funds, including through the introduction of computer viruses, “phishing” attempts and other forms of social engineering. For example, in 2017, we were the subject of a cyber-attack against our internal network servers. We promptly took action to (1) secure the affected servers offline and implement new security measures designed to prevent similar cyber-attacks in the future, (2) notify all investors in the affected funds of this security breach, and (3) restore corrupted and stolen data from backup files.
Cyberattacks and other security threats could originate from a wide variety of external sources, including cyber criminals, nation state hackers, hacktivists and other outside parties. Cyberattacks and other security threats could also originate from the malicious or accidental acts of insiders, such as employees. There can be no assurance that measures we take to ensure the integrity of our systems will provide protection, especially because cyberattack techniques used change frequently or are not recognized until successful. If our systems are compromised, do not operate properly or are disabled, or we fail to provide the appropriate regulatory or other notifications in a timely manner, we could suffer financial loss, a disruption of our businesses, liability to our investment funds and fund investors, regulatory intervention or reputational damage. The costs related to cyber or other security threats or disruptions may not be fully insured or indemnified by other means.
Cybersecurity has become a top priority for regulators. Many jurisdictions in which we operate have laws and regulations relating to data privacy, cybersecurity and protection of personal information, including, as examples the General Data Protection Regulation (“GDPR”) in the European Union that went into effect in May 2018 and the California Consumer Privacy Act (“CCPA”). Some jurisdictions have also enacted laws requiring companies to notify individuals and government agencies of data security breaches involving certain types of personal data.
While we and our service providers have established enhanced data-security measures, business continuity plans and information technology systems designed to prevent cyber-attacks from reoccurring in the future, there are inherent limitations in such plans and systems including the possibility that certain risks have not been identified. Similar types of cyber security risks are also present for service providers and other third parties with which we do business. These service providers and other third parties may hold our information or fund investor information and not have the same level of protection as we maintain for their information or may nevertheless be subject to risk of breach even with enhanced data security measures, any of which could result in material adverse consequences for us.
Finally, we rely on third-party service providers for certain aspects of our business, including for certain information systems and technology and administration of our funds. Any interruption or deterioration in the performance of these third parties or failures of their information systems and technology could impair the quality of the funds’ operations and could affect our reputation and hence adversely affect our business, financial condition and results of operations.
Changes in, or any failure to comply with, data privacy laws, regulations, and standards may adversely affect our business.
Data privacy and data security have become significant issues in the United States, Europe, and in many other jurisdictions. The regulatory framework for data privacy and security issues worldwide is rapidly evolving and is likely to remain uncertain and continue evolving for the foreseeable future. Federal, state, or foreign government bodies or agencies have in the past adopted, and may in the future adopt, additional laws and regulations affecting data privacy.
27
Within the United States, there are a number of federal laws that impose limits on or requirements regarding the collection, distribution, use, security and storage of personal data of individuals. For example, the Federal Trade Commission (the “FTC”) Act grants the FTC authority to enforce against unfair or deceptive practices, which the FTC has interpreted to require companies’ practices with respect to personal data to comply with the commitments posted in their privacy policies. The U.S. Federal Trade Commission and numerous state attorneys general also are applying federal and state consumer protection laws to impose standards on the online collection, use and dissemination of personal data, and to the security measures applied to such data.
Additionally, state legislatures have begun to adopt comprehensive privacy laws. For example, the CCPA, which became effective in 2020, requires (among other things) companies that process personal information of California residents to make new disclosures to consumers about their data collection, use and sharing practices and gives California residents expanded rights related to their personal information, including the right to access and delete their personal information, and receive detailed information about how their personal information is used and shared. The enactment of the CCPA is prompting a wave of similar legislative developments in other states in the United States, which creates the potential for a patchwork of overlapping but different state laws and could mark the beginning of a trend toward more stringent privacy legislation in the United States, which could increase our potential liability and adversely affect our business, results of operations, and financial condition. California voters recently approved a new privacy law, the California Privacy Rights Act (the “CPRA”), which will become effective in most material respects starting on January 1, 2023. The CPRA will significantly modify the CCPA and will restrict use of certain categories of sensitive personal information that we handle, further restrict the use of cross-context behavioral advertising techniques on which our platform relies, establish restrictions on the retention of personal information, expand the types of data breaches subject to the private right of action and establish the California Privacy Protection Agency to implement and enforce the new law and impose administrative fines. In addition, both Virginia and Colorado have enacted comprehensive data privacy statutes similar to the CCPA and CPRA, which become effective in 2023. Similar laws also have been proposed at the federal level. The effects of recently proposed or enacted legislation are potentially far-reaching and may require us to modify our data processing practices and policies and to incur substantial costs and expenses in an effort to comply. We cannot be sure how these regulations will be interpreted, enforced or applied to our operations.
Internationally, many jurisdictions in which the Company operates have established or enhanced their own data security and privacy legal framework with which the Company or its customers must comply, including but not limited to, the European Union’s General Data Protection Regulation (the “GDPR”), which imposes stringent operational requirements, including, for example, requiring expanded disclosures about how personal information is used, limitations on retention of information, mandatory data breach notification obligations, and higher standards for obtaining consent to process personal information. The GDPR provides that EU member states may make their own additional laws and regulations in relation to certain data processing activities. Recent legal developments in the EU have created complexity and uncertainty regarding transfers of personal information from the EU to “third countries,” especially the United States. For example, in 2020 the Court of Justice of the EU invalidated the EU-U.S. Privacy Shield Framework (a mechanism for the transfer of personal information from the EU to the US) and made clear that reliance on standard contractual clauses (another mechanism for the transfer of personal information outside of the EU) alone may not be sufficient in all circumstances. In addition, after the United Kingdom, or UK, left the EU, the UK enacted the UK GDPR, which together with the amended UK Data Protection Act 2018 retains the GDPR in UK national law, but also creates complexity and uncertainty regarding transfers between the UK and the EU, which could further limit our ability to use and share personal data and require localized changes to our operating model.
In many jurisdictions, enforcement actions and consequences for noncompliance are also rising. In addition to government regulation, privacy advocates and industry groups may propose new and different self-regulatory standards that either legally or contractually apply to the Company. The changing legal and regulatory landscape could in the future further limit our ability to use and share personal information and require changes to our operating model. Furthermore, any inability or perceived inability, even if unfounded, to comply with the relevant laws and regulations could result in regulatory investigations and penalties, negative publicity and reputational harm.
28
Employee misconduct could harm us by impairing our ability to attract and retain fund investors and subjecting us to significant legal liability and reputational harm.
There is a risk that our employees could engage in misconduct that adversely affects our business. We have a large employee headcount relative to many of our peers due to our vertically integrated business model. We are subject to a number of obligations and standards arising from our advisory and investment management businesses and our discretionary authority over the assets we manage. The violation of these obligations and standards by any of our employees would adversely affect our funds and us. Our business often requires that we deal with confidential matters. If our employees were to improperly use or disclose confidential information, we could be subject to legal or regulatory action and suffer serious harm to our reputation, financial position and current and future business relationships. It is not always possible to detect or deter employee misconduct, and the extensive precautions we take to detect and prevent this activity may not be effective in all cases.
Employee misconduct may include binding us to unauthorized transactions or present unacceptable risks. Losses could also result from actions by third-party service providers, including the misappropriation of assets. We may also be adversely affected if there is misconduct by management or employees of companies involved in real estate projects in which we invest, and we may be unable to control or mitigate such misconduct. Further, although we have adopted measures reasonably designed to prevent and detect employee misconduct and to select reliable third-party service providers, such measures may not be effective in all cases. If one of our employees were to engage in misconduct or were to be accused of such misconduct, our business and our reputation could be materially and adversely affected.
We may face damage to our professional reputation and legal liability if our services are not regarded as satisfactory or for other reasons.
As an investment manager, we depend to a large extent on our relationships with our fund investors and our reputation for integrity and high-caliber professional services to attract and retain fund investors. As a result, if a fund investor is not satisfied with our services, such dissatisfaction may be more damaging to our business than to other types of businesses.
In recent years, the volume of claims and amount of damages claimed in litigation and regulatory proceedings against financial advisors has been increasing. Our asset management and advisory activities may subject us to the risk of significant legal liabilities to our funds and third parties, including our fund investors or beneficiaries, under securities or other laws and regulations for materially false or misleading statements made in connection with securities and other transactions. In our investment management business, we make investment decisions on behalf of our fund investors that could result in substantial losses. Any such losses also may subject us to the risk of legal and regulatory liabilities or actions alleging negligent misconduct, breach of fiduciary duty or breach of contract. These risks often may be difficult to assess or quantify and their existence and magnitude often remain unknown for substantial periods of time. We may incur significant legal expenses in defending litigation. In addition, litigation or regulatory action against us may tarnish our reputation and harm our ability to attract and retain fund investors. Substantial legal or regulatory liability could materially and adversely affect our business, financial condition or results of operations or cause significant reputational harm to us, which could seriously harm our business.
Our failure to appropriately manage conflicts of interest could damage our reputation and adversely affect our business.
Actual, potential or perceived conflicts can give rise to fund investor dissatisfaction, litigation or regulatory enforcement actions. Appropriately managing conflicts of interest is complex and difficult and our reputation could be damaged if we fail, or appear to fail, to deal appropriately with one or more potential or actual conflicts of interest. Enforcement action or litigation asserting improper management of conflicts of interest, even if unproven, could harm our reputation and our business in a number of ways, including affecting our ability to raise additional funds causing existing fund investors to reduce or terminate doing business with us.
A change of control of our company could result in an assignment of our investment management agreements.
Under the Investment Advisers Act of 1940, or the Investment Advisers Act, each of the investment management agreements for the funds and other accounts we manage must provide that it may not be assigned without the consent of the particular fund or other account. An assignment may occur under the Investment Advisers Act if, among other things, we or the Operating Company undergoes a change of control. If a change of control transaction occurs, we cannot be certain that our relevant SEC-registered investment adviser subsidiaries will be able to obtain the necessary consents from our funds and other accounts, which could cause us to lose the management fees and performance fees we earn from such funds and other accounts.
29
In certain circumstances, investors in our funds have the right to remove us as the general partner of the relevant fund and to terminate the investment period or terminate our investment management under certain circumstances, leading to a decrease in our revenues, which could be substantial.
The governing agreements of our funds provide that, subject to certain conditions, investors in those funds have the right to remove us as the general partner of the relevant fund or terminate the fund. Any such removal or dissolution could result in a cessation in management fees we would earn from such funds or a significant reduction in the expected amounts of carried interest or incentive fees from those funds.
Dependence on leverage by certain funds and investments subjects us to volatility and contractions in the debt financing markets and could adversely affect the ability of our funds to achieve attractive rates of return on those investments.
Our funds rely on the debt financing markets for financing leverage for investments, and volatility or contractions in those markets could impact the performance of our investments or inhibit our ability to make new investments. In addition, the transition of major banking institutions away from use of the London Interbank Offered Rate, or LIBOR, remains a cause of significant uncertainty in the markets in which we are active. Any such events could adversely affect the availability of credit generally, the cost or terms on which lenders are willing to lend, or the strength of the overall economy.
The absence of available sources of sufficient debt financing for extended periods of time or an increase in either the general levels of interest rates or in the risk spread demanded by sources of indebtedness would make it more expensive to finance those investments. Certain investments may also be financed through fund-level debt facilities, which may or may not be available for refinancing at the end of their respective terms. In addition, the interest payments on the indebtedness used to finance our funds’ investments are generally deductible expenses for income tax purposes, subject to limitations under applicable tax law and policy. Any change in such tax law or policy to eliminate or limit these income tax deductions, as has been discussed from time to time in various jurisdictions, would reduce the after-tax rates of return on the affected investments.
Risks Related to Our Industry
The investment management business is intensely competitive.
The investment management business is intensely competitive, with competition based on a variety of factors, including investment performance, the quality of service provided to fund investors, brand recognition and business reputation. Our investment management business competes with a variety of traditional and alternative asset managers, commercial banks, investment banks and other financial institutions. A number of factors serve to increase our competitive risks:
This competitive pressure could adversely affect our ability to make successful investments and restrict our ability to raise future funds, either of which would materially and adversely impact our business, financial condition and results of operations.
30
Difficult market conditions can adversely affect our business by reducing the market value of the assets we manage or causing our fund investors to reduce their investments.
The future global market and economic climate may deteriorate because of many factors beyond our control, including rising interest rates or inflation, the availability of credit, changes in laws, war, such as the ongoing conflict between Russia and Ukraine, terrorism, the effect of pandemic diseases, such as COVID-19 or any variation thereof, or political uncertainty. We may not be able to or may choose not to manage our exposure to certain of these market conditions. Market deterioration could cause us or the funds we manage to experience tightening of liquidity, reduced earnings and cash flow, and impairment charges, as well as challenges in raising additional capital, obtaining investment financing and making investments on attractive terms. These market conditions can also have an impact on our ability to liquidate positions in a timely and efficient manner.
Our business could generate lower revenue in a general economic downturn or a tightening of global credit markets. A general economic downturn or tightening of global credit markets may result in reduced opportunities to find suitable investments and make it more difficult for us or our funds to exit and realize value from existing investments, potentially resulting in a decline in the value of the investments held in our funds. Such a decline could cause our revenue and net income to decline.
A general economic downturn or a tightening of global credit markets may also reduce the commitments our fund investors are able to devote to alternative investments generally and make it more difficult for our funds to obtain funding for additional investments at attractive rates, which would further reduce our profitability.
Our profitability may also be adversely affected by our fixed costs and the possibility that we would be unable to scale back other costs within a time frame sufficient to match any decreases in revenue relating to changes in market and economic conditions. If our revenue declines without a commensurate reduction in our expenses, our net income will be reduced. Accordingly, difficult market conditions could materially and adversely affect our business, financial condition and results of operations.
Increased government regulation, compliance failures and changes in law or regulation could adversely affect us and the operation of our funds.
Governmental authorities around the world in recent years have called for or implemented financial system and participant regulatory reform in reaction to volatility and disruption in the global financial markets, financial institution failures and financial frauds. Such reform includes, among other things, additional regulation of investment funds, as well as their managers and activities, including compliance, risk management and anti-money laundering procedures; restrictions on specific types of investments and the provision and use of leverage; implementation of capital requirements; limitations on compensation to managers; and books and records, reporting and disclosure requirements. We cannot predict with certainty the impact on us, our funds, or on private markets funds generally, of any such reforms. Any of these regulatory reform measures could have an adverse effect on our funds’ investment strategies or our business model. We may incur significant expense in order to comply with such reform measures. Additionally, legislation, including proposed legislation regarding executive compensation and taxation of carried interest, may adversely affect our ability to attract and retain key personnel.
Our advisory and investment management businesses are subject to regulation in the United States, including by the Securities and Exchange Commission, or the SEC, the Commodity Futures Trading Commission, or the CFTC, the Internal Revenue Service, or the IRS, and other regulatory agencies, pursuant to, among other laws, the Investment Advisers Act, the Securities Act, the Internal Revenue Code of 1986, as amended, or the Code, and the Securities Exchange Act of 1934, as amended, or the Exchange Act. Any change in such regulation or oversight may have a material adverse impact on our operating results. For example, the SEC has recently announced proposed rules applicable to investment managers, which, if enacted, could materially increase our regulatory compliance costs. Our failure to comply with applicable laws or regulations could result in fines, suspensions of personnel or other sanctions, including revocation of our registration as an investment adviser. Even if a sanction imposed against us or our personnel is small in monetary amount, the adverse publicity arising from the imposition of sanctions against us by regulators could harm our reputation and cause us to lose existing fund investors or fail to gain new fund investors.
31
As a result of recent highly publicized financial scandals, investors have exhibited concerns over the integrity of the U.S. financial markets, and the regulatory environment in which we operate is subject to further regulation in addition to those rules already promulgated. For example, there are a significant number of new and proposed regulations that may affect our business under the Dodd-Frank Wall Street Reform and Consumer Protection Act of 2010, or the Dodd-Frank Act. The SEC in particular has increased its regulation of the asset management and the private equity industry in recent years, focusing on the private equity industry’s fees, allocation of expenses to funds, valuation practices, allocation of fund investment opportunities, disclosures to fund investors, the allocation of broken-deal expenses and general conflicts of interest disclosures. The SEC has also heightened its focus on the valuation processes employed by investment advisers. The lack of readily ascertainable market prices for many of the investments made by our funds could subject our valuation policies and processes to increased scrutiny by the SEC. We may be adversely affected as a result of new or revised legislation or regulations imposed by the SEC, other U.S. or foreign governmental regulatory authorities or self-regulatory organizations that supervise the financial markets.
Our tenant insurance business is subject to significant governmental regulation. The regulatory authorities generally have broad discretion to grant, renew and revoke licenses and approvals, to promulgate, interpret and implement regulations, and to evaluate compliance with regulations through periodic examinations, audits and investigations of the affairs of insurance providers. As a result of regulatory or private action in any jurisdiction, we may be temporarily or permanently suspended from continuing some or all of our insurance activities, or otherwise fined or penalized or suffer an adverse judgment, which could adversely affect our business and results of operations.
In addition, we are registered as an investment adviser with the SEC and we are subject to the requirements and regulations of the Investment Advisers Act. Such requirements relate to, among other things, restrictions on entering into transactions with fund investors, maintaining an effective compliance program, incentive fees, solicitation arrangements, allocation of investments, recordkeeping and reporting requirements, disclosure requirements, limitations on agency cross and principal transactions between an adviser and their advisory clients, as well as general anti-fraud prohibitions. As a registered investment adviser, we have fiduciary duties to our fund investors. A failure to comply with the obligations imposed by the Advisers Act, including recordkeeping, advertising and operating requirements, disclosure obligations and prohibitions on fraudulent activities, could result in investigations, sanctions and reputational damage, and could materially and adversely affect our business, financial condition and results of operations.
Federal, state and foreign anti-corruption and sanctions laws create the potential for significant liabilities and penalties and reputational harm.
We are also subject to a number of laws and regulations governing payments and contributions to political persons or other third parties, including restrictions imposed by the Foreign Corrupt Practices Act, or the FCPA, as well as trade sanctions and export control laws administered by the Office of Foreign Assets Control, or OFAC, the U.S. Department of Commerce and the U.S. Department of State. The FCPA is intended to prohibit bribery of foreign governments and their officials and political parties, and requires public companies in the United States to keep books and records that accurately and fairly reflect those companies’ transactions. OFAC, the U.S. Department of Commerce and the U.S. Department of State administer and enforce various export control laws and regulations, including economic and trade sanctions based on U.S. foreign policy and national security goals against targeted foreign states, organizations and individuals. These laws and regulations relate to a number of aspects of our business, including servicing existing fund investors and finding new fund investors.
Similar laws in non-U.S. jurisdictions, such as EU sanctions or the U.K. Bribery Act, as well as other applicable anti-bribery, anti-corruption, anti-money laundering, or sanction or other export control laws in the U.S. and abroad, may also impose stricter or more onerous requirements than the FCPA, OFAC, the U.S. Department of Commerce and the U.S. Department of State, and implementing them may disrupt our business or cause us to incur significantly more costs to comply with those laws. Different laws may also contain conflicting provisions, making compliance with all laws more difficult. If we fail to comply with these laws and regulations, we could be exposed to claims for damages, civil or criminal financial penalties, reputational harm, incarceration of our employees, restrictions on our operations and other liabilities, which could negatively affect our business, operating results and financial condition. In addition, we may be subject to successor liability for FCPA violations or other acts of bribery, or violations of applicable sanctions or other export control laws committed by companies in which we invest or which we acquire. While we have developed and implemented policies and procedures designed to ensure strict compliance by us and our personnel with the FCPA and other anti-corruption, sanctions and export control laws in jurisdictions in which we operate, such policies and procedures may not be effective in all instances to prevent violations. Any determination that we have violated the FCPA or other applicable anti-corruption, sanctions or export control laws could subject us to, among other things, civil and criminal penalties, material fines, profit disgorgement, injunctions on future conduct, securities litigation and a general loss of investor confidence, any one of which could adversely affect our business prospects, financial condition, results of operations or the market value of our Class A common stock.
32
Regulation of investment advisors outside the United States could adversely affect our ability to operate our business.
We provide investment advisory and other services and raise funds in a number of countries and jurisdictions outside the United States. In many of these countries and jurisdictions, which include the European Union, or the EU, the European Economic Area, or the EEA, the individual member states of each of the EU and EEA, South Korea, the Cayman Islands and Canada, we and our operations, and in some cases our personnel, are subject to regulatory oversight and requirements. In general, these requirements relate to registration, licenses, periodic inspections, the provision and filing of periodic reports, and obtaining certifications and other approvals. Across the EU, we are subject to the European Union Alternative Investment Fund Managers Directive, or the AIFMD, under which we are subject to regulatory requirements regarding, among other things, registration for marketing activities, the structure of remuneration for certain of our personnel and reporting obligations. Individual member states of the EU have imposed additional requirements that may include internal arrangements with respect to risk management, liquidity risks, asset valuations, and the establishment and security of depository and custodial requirements. Because some EEA countries have not yet incorporated the AIFMD into their agreement with the EU, we may undertake marketing activities and provide services in those EEA countries only in compliance with applicable local laws. Outside the EEA, the regulations to which we are subject primarily relate to registration and reporting obligations.
It is expected that additional laws and regulations will come into force in the EEA, the EU, and other countries in which we operate over the coming years. These laws and regulations may affect our costs and manner of conducting business in one or more markets, the risks of doing business, the assets that we manage or advise, and our ability to raise capital from fund investors. In addition, the exit of the United Kingdom from the EU may have adverse economic, political and regulatory effects on the operation of our business. Any failure by us to comply with either existing or new laws or regulations could have a material adverse effect on our business, financial condition and results of operations.
Risks Related to Our Organizational Structure
Because our principal asset is our interest in the Operating Company, we depend on distributions from the Operating Company to pay our taxes and expenses, including payments under the Tax Receivable Agreement and to pay dividends to holders of our Class A common stock. The Operating Company’s ability to make such distributions may be subject to various limitations and restrictions.
We are a holding company that has no material assets other than our ownership of Class A Units in the Operating Company. As such, we have no independent means of generating revenue or cash flow, and our ability to pay our taxes and operating expenses or declare and pay dividends in the future, if any, is dependent upon the financial results and cash flows of the Operating Company and its subsidiaries and distributions we receive from the Operating Company. There can be no assurance that the Operating Company and its subsidiaries will generate sufficient cash flow to distribute funds to us or that applicable state law and contractual restrictions, including negative covenants in our debt instruments, will permit such distributions.
33
The Operating Company is treated as a partnership for U.S. federal income tax purposes and, as such, generally is not subject to any entity-level U.S. federal income tax. Instead, any taxable income of the Operating Company is allocated to holders of Class A Units, including us. Accordingly, we incur income taxes on our allocable share of any net taxable income of the Operating Company. Under the terms of the Operating Company Agreement, the Operating Company is obligated, subject to various limitations and restrictions, including with respect to our debt agreements, to make tax distributions to holders of Class A Units, including us. In addition to tax expenses, we also incur expenses related to our operations, including payments under the Tax Receivable Agreement, which we expect could be significant. We intend, as its managing member, to cause the Operating Company to make cash distributions to the holders of Class A Units in an amount sufficient to (1) fund all or part of their tax obligations in respect of taxable income allocated to them and (2) cover our operating expenses, including payments under the Tax Receivable Agreement. However, the Operating Company’s ability to make such distributions may be subject to various limitations and restrictions, such as restrictions on distributions that would either violate any contract or agreement to which the Operating Company is then a party, including debt agreements, or any applicable law, or that would have the effect of rendering the Operating Company insolvent. If we do not have sufficient funds to pay tax or other liabilities, or to fund our operations (including, if applicable, as a result of an acceleration of our obligations under the Tax Receivable Agreement), we may have to borrow funds, which could materially and adversely affect our liquidity and financial condition, and subject us to various restrictions imposed by any lenders of such funds. To the extent we are unable to make timely payments under the Tax Receivable Agreement for any reason, such payments generally will be deferred and will accrue interest until paid; provided, however, that nonpayment for a specified period may constitute a material breach of a material obligation under the Tax Receivable Agreement resulting in the acceleration of payments due under the Tax Receivable Agreement. In addition, if the Operating Company does not have sufficient funds to make distributions, our ability to declare and pay cash dividends will also be restricted or impaired. Under the Operating Company Agreement, we intend to cause the Operating Company, from time to time, to make distributions in cash to its equityholders (including us) in amounts sufficient to cover the taxes imposed on their allocable share of taxable income of the Operating Company. As a result of (1) potential differences in the amount of net taxable income allocable to us and to the Operating Company’s other equityholders, (2) the lower tax rate applicable to corporations as opposed to individuals, and (3) certain tax benefits that we anticipate from (a) future purchases or redemptions of Class A Units from the Continuing Equity Owners, (b) payments under the Tax Receivable Agreement and (c) any acquisition of interests in the Operating Company from other equityholders in connection with the consummation of the Transactions, these tax distributions may be in amounts that exceed our tax liabilities. Our board of directors determines the appropriate uses for any excess cash so accumulated, which may include, among other uses, the payment of obligations under the Tax Receivable Agreement and the payment of other expenses. We have no obligation to distribute such cash (or other available cash) to our stockholders. No adjustments to the exchange ratio for Class A Units and corresponding shares of Class A common stock will be made as a result of any cash distribution by us or any retention of cash by us. To the extent we do not distribute such excess cash as dividends on our Class A common stock we may take other actions with respect to such excess cash, for example, holding such excess cash, or lending it (or a portion thereof) to the Operating Company, which may result in shares of our Class A common stock increasing in value relative to the value of Class A Units. The holders of Class A Units may benefit from any value attributable to such cash balances if they acquire shares of Class A common stock in exchange for their Class A Units, notwithstanding that such holders may have participated previously as holders of Class A Units in distributions that resulted in such excess cash balances.
The Tax Receivable Agreement with the Continuing Equity Owners requires us to make cash payments to them in respect of certain tax benefits to which we may become entitled, and we expect that such payments will be substantial.
We entered into a Tax Receivable Agreement with the Operating Company and each of the Continuing Equity Owners. Under the Tax Receivable Agreement, we are required to make cash payments to the Continuing Equity Owners equal to 85% of the tax benefits, if any, that we actually realize, or in certain circumstances are deemed to realize, as a result of (1) the increases in our allocable share of the tax basis of the Operating Company’s assets resulting from any future redemptions or exchanges of Class A Units from the Continuing Equity Owners, and certain distributions (or deemed distributions) by the Operating Company; (2) our allocable share of the existing tax basis of the Operating Company’s assets at the time of any redemption or exchange of Class A Units, which tax basis is allocated to the Class A Units being redeemed or exchanged and acquired by us; and (3) certain other tax benefits arising from payments under the Tax Receivable Agreement. We expect that the amount of the cash payments we will be required to make under the Tax Receivable Agreement will be substantial.
34
Any payments made by us to the Continuing Equity Owners under the Tax Receivable Agreement will not be available for reinvestment in our business and will generally reduce the amount of overall cash flow that might have otherwise been available to us. To the extent that we are unable to make timely payments under the Tax Receivable Agreement for any reason, the unpaid amounts will be deferred and will accrue interest until paid by us. Payments under the Tax Receivable Agreement are not conditioned upon one or more of the Continuing Equity Owners maintaining a continued ownership interest in the Operating Company. Furthermore, our future obligation to make payments under the Tax Receivable Agreement could make us a less attractive target for an acquisition, particularly in the case of an acquirer that cannot use some or all of the tax benefits that are the subject of the Tax Receivable Agreement. The actual existing tax basis the actual increase in tax basis, and the actual utilization of any resulting tax benefits, as well as the amount and timing of any payments under the Tax Receivable Agreement, will vary depending upon a number of factors including the timing of redemptions by the Continuing Equity Owners; the price of shares of our Class A common stock at the time of the exchange; the extent to which such exchanges are taxable; the amount of gain recognized by such Continuing Equity Owners; the amount and timing of the taxable income allocated to us or otherwise generated by us in the future; the portion of our payments under the Tax Receivable Agreement constituting imputed interest; and the federal and state tax rates then applicable.
The Continuing Equity Owners are entitled to certain benefits to which holders of our Class A common stock are not entitled or are not entitled to the same extent.
Our organizational structure, including the Tax Receivable Agreement, confers certain benefits upon the Continuing Equity Owners that does not benefit the holders of our Class A common stock to the same extent that it benefits the Continuing Equity Owners. We entered into the Tax Receivable Agreement with the Operating Company and the Continuing Equity Owners, which provides for the payment by us to the Continuing Equity Owners of 85% of the amount of tax benefits, if any, that we actually realize, or in some circumstances are deemed to realize, as a result of (1) the increases in our allocable share of the tax basis of the Operating Company’s assets resulting from any future redemptions or exchanges of Class A Units from the Continuing Equity Owners and certain distributions (or deemed distributions) by the Operating Company; (2) our allocable share of the existing tax basis of the Operating Company’s assets at the time of any redemption or exchange of Class A Units, which tax basis is allocated to the Class A Units being redeemed or exchanged and acquired by us, and (3) certain other tax benefits arising from payments under the Tax Receivable Agreement. Although we will retain 15% of the amount of such tax benefits, this and other aspects of our organizational structure may adversely impact the future trading market for the Class A common stock.
In certain cases, payments under the Tax Receivable Agreement to the Continuing Equity Owners may be accelerated or significantly exceed any actual benefits we realize in respect of the tax attributes subject to the Tax Receivable Agreement.
The Tax Receivable Agreement provides that if (1) we materially breach any of our material obligations under the Tax Receivable Agreement, (2) certain mergers, asset sales, other forms of business combinations or other changes of control were to occur, or (3) we elect an early termination of the Tax Receivable Agreement, then our obligations, or our successor’s obligations, under the Tax Receivable Agreement to make payments would be based on certain assumptions, including an assumption that we would have sufficient taxable income to fully utilize all potential future tax benefits that are subject to the Tax Receivable Agreement.
As a result of the foregoing, we would be required to make an immediate cash payment equal to the present value of the anticipated future tax benefits that are the subject of the Tax Receivable Agreement, based on certain assumptions, which payment may be made significantly in advance of the actual realization, if any, of such future tax benefits. We could also be required to make cash payments to the Continuing Equity Owners that are greater than the specified percentage of any actual benefits we ultimately realize in respect of the tax benefits that are subject to the Tax Receivable Agreement. In these situations, our obligations under the Tax Receivable Agreement could have a substantial negative impact on our liquidity and could have the effect of delaying, deferring or preventing certain mergers, asset sales, other forms of business combinations or other changes of control. There can be no assurance that we will be able to fund or finance our obligations under the Tax Receivable Agreement. We may need to incur debt to finance payments under the Tax Receivable Agreement to the extent our cash resources are insufficient to meet our obligations under the Tax Receivable Agreement as a result of timing discrepancies or otherwise.
35
We will not be reimbursed for any payments made to the Continuing Equity Owners under the Tax Receivable Agreement in the event that any tax benefits are disallowed.
Payments under the Tax Receivable Agreement are made based on the tax reporting positions that we determine, and the U.S. Internal Revenue Service, or the IRS, or another tax authority, may challenge all or part of the tax basis increases or other tax benefits we claim, as well as other related tax positions we take, and a court could sustain such challenge. We will not be reimbursed for any cash payments previously made to the Continuing Equity Owners under the Tax Receivable Agreement in the event that any tax benefits initially claimed by us and for which payment has been made to a Continuing Equity Owner are subsequently challenged by a taxing authority and are ultimately disallowed. Instead, any excess cash payments made by us to a Continuing Equity Owner will be netted against any future cash payments we might otherwise be required to make to such Continuing Equity Owner under the terms of the Tax Receivable Agreement. However, we might not determine that we have effectively made an excess cash payment to a Continuing Equity Owner for a number of years following the initial time of such payment and, if any of our tax reporting positions are challenged by a taxing authority, we are not permitted to reduce any future cash payments under the Tax Receivable Agreement until any such challenge is finally settled or determined. Moreover, the excess cash payments we made previously under the Tax Receivable Agreement could be greater than the amount of future cash payments against which we would otherwise be permitted to net such excess. The applicable U.S. federal income tax rules for determining applicable tax benefits we may claim are complex and fact-specific in nature, and there can be no assurance that the IRS or a court will not disagree with our tax reporting positions. As a result, payments could be made under the Tax Receivable Agreement significantly in excess of any actual cash tax savings that we realize in respect of the tax attributes with respect to any Continuing Equity Owner that are the subject of the Tax Receivable Agreement.
Unanticipated changes in effective tax rates or adverse outcomes resulting from examination of our income or other tax returns could adversely affect our results of operations and financial condition.
We are subject to taxes by U.S. federal, state, local and foreign tax authorities. Our future effective tax rates could be subject to volatility or adversely affected by a number of factors, including:
In addition, we may be subject to audits of our income, sales and other taxes by U.S. federal, state, and local and foreign taxing authorities. Outcomes from these audits could have an adverse effect on our operating results and financial condition.
36
If we were deemed to be an investment company under the Investment Company Act of 1940, as amended, or the 1940 Act, including as a result of our ownership of the Operating Company, applicable restrictions could make it impractical for us to continue our business as contemplated and could have a material adverse effect on our business.
Under Sections 3(a)(1)(A) and (C) of the 1940 Act, a company generally will be deemed to be an “investment company” for purposes of the 1940 Act if (1) it is, or holds itself out as being, engaged primarily, or proposes to engage primarily, in the business of investing, reinvesting or trading in securities, or (2) it engages, or proposes to engage, in the business of investing, reinvesting, owning, holding or trading in securities and it owns or proposes to acquire investment securities having a value exceeding 40% of the value of its total assets (exclusive of U.S. government securities and cash items) on an unconsolidated basis. We do not believe that we are an “investment company,” as such term is defined in either of those sections of the 1940 Act. We and the Operating Company intend to conduct our operations so that we will not be deemed an investment company. As the sole managing member of the Operating Company, we will control and operate the Operating Company. On that basis, we believe that our interest in the Operating Company is not an “investment security” as that term is used in the 1940 Act. However, if we were to cease participation in the management of the Operating Company, or if the Operating Company itself becomes an investment company, our interest in the Operating Company could be deemed an “investment security” for purposes of the 1940 Act. If it were established that we were an unregistered investment company, there would be a risk that we would be subject to monetary penalties and injunctive relief in an action brought by the SEC, that we would be unable to enforce contracts with third parties and that third parties could seek to obtain rescission of transactions undertaken during the period it was established that we were an unregistered investment company. If we were required to register as an investment company, restrictions imposed by the 1940 Act, including limitations on our capital structure and our ability to transact with affiliates, could make it impractical for us to continue our business as contemplated and could have a material adverse effect on our business.
Risks Related to Ownership of Our Class A Common Stock
The Continuing Equity Owners have significant influence over us, including control over decisions that require the approval of stockholders.
The Continuing Equity Owners control, in the aggregate, over 95% of the voting power represented by all our outstanding classes of stock. As a result, the Continuing Equity Owners exercise significant influence over all matters requiring stockholder approval, including the election and removal of directors and the size of our board of directors, any amendment of our amended and restated certificate of incorporation or bylaws and any approval of significant corporate transactions (including a sale of all or substantially all of our assets), and have significant control over our business, affairs and policies, including the appointment of our management. The directors that Continuing Equity Owners elect have the authority to vote to authorize the Company to incur additional debt, issue or repurchase stock, declare dividends and make other decisions that could be detrimental to stockholders.
The members of our board of directors are, and likely will continue to be, appointed by and/or affiliated with the Continuing Equity Owners who have the ability to appoint the majority of directors. The Continuing Equity Owners can take actions that have the effect of delaying or preventing a change of control of us or discouraging others from making tender offers for our shares, which could prevent stockholders from receiving a premium for their shares. These actions may be taken even if other stockholders oppose them. The concentration of voting power with the Continuing Equity Owners may have an adverse effect on the price of our Class A common stock. The Continuing Equity Owners may have interests that are different from yours and may vote in a way with which you disagree and that may be adverse to your interests.
37
We cannot predict the effect our dual class structure may have on the market price of our Class A common stock.
We cannot predict whether our dual class structure will result in a lower or more volatile market price of our Class A common stock, in adverse publicity, or other adverse consequences. For example, certain index providers have announced restrictions on including companies with multiple-class share structures in certain of their indices. In July 2017, FTSE Russell announced that it plans to require new constituents of its indices to have greater than 5% of the company’s voting rights in the hands of public stockholders, and S&P Dow Jones announced that it will no longer admit companies with multiple-class share structures to certain of its indices. Affected indices include the Russell 2000 and the S&P 500, S&P MidCap 400, and S&P SmallCap 600, which together make up the S&P Composite 1500. Also in 2017, MSCI, a leading stock index provider, opened public consultations on their treatment of no-vote and multi-class structures and temporarily barred new multi-class listings from certain of its indices and in October 2018, MSCI announced its decision to include equity securities “with unequal voting structures” in its indices and to launch a new index that specifically includes voting rights in its eligibility criteria. Under such announced policies, the dual class structure of our stock would make us ineligible for inclusion in certain indices and, as a result, mutual funds, exchange-traded funds and other investment vehicles that attempt to track those indices would not invest in our Class A common stock. These policies are relatively new and it is unclear what effect, if any, they will have on the valuations of publicly traded companies excluded from such indices, but it is possible they may depress valuations, compared to similar companies that are included. Given the sustained flow of investment funds into passive strategies that seek to track certain indices, exclusion from certain stock indices would likely preclude investment by many of these funds and could make our Class A common stock less attractive to other investors. As a result, the market price of our Class A common stock could be adversely affected.
We are a “controlled company” within the meaning of the NYSE rules and, as a result, qualify for, and rely on, exemptions from certain corporate governance requirements. You may not have the same protections afforded to stockholders of companies that are subject to such corporate governance requirements.
The parties to the Stockholders Agreement have more than 50% of the voting power for the election of directors, and, as a result, we are considered a “controlled company” within the meaning of the NYSE rules. As such, we qualify for, and rely on, exemptions from certain corporate governance requirements, including the requirements to have a majority of independent directors on our board of directors, an entirely independent nominating and corporate governance committee, an entirely independent compensation committee or to perform annual performance evaluations of the nominating and corporate governance and compensation committees.
The corporate governance requirements and, specifically, the independence standards are intended to ensure directors who are considered independent are free of any conflicting interest that could influence their actions as directors. We utilize certain exemptions afforded to a “controlled company.” As a result, we are not subject to certain corporate governance requirements, including that a majority of our board of directors consists of “independent directors,” as defined under the NYSE rules. Therefore, we do not have a majority of independent directors on our board of directors or a nominating and corporate governance committee or compensation committee (or perform annual performance evaluations of nominating and corporate governance and compensation committees, if any) and may not unless and until such time as we are required to do so.
Accordingly, you may not have the same protections afforded to stockholders of companies that are subject to all of the corporate governance requirements of the NYSE rules. Our status as a controlled company could make our Class A common stock less attractive to some investors or otherwise harm our stock price.
The JOBS Act will allow us to postpone the date by which we must comply with certain laws and regulations intended to protect investors and to reduce the amount of information we provide in our reports filed with the SEC. We cannot be certain if this reduced disclosure will make our Class A common stock less attractive to investors.
The JOBS Act is intended to reduce the regulatory burden on “emerging growth companies.” As defined in the JOBS Act, a public company whose initial public offering of common equity securities occurs after December 8, 2011, and whose annual net revenues are less than $1.07 billion will, in general, qualify as an “emerging growth company” until the earliest of:
38
Under this definition, we are an “emerging growth company” and could remain an “emerging growth company” until as late as the fifth anniversary of the completion of our initial public offering. For so long as we are an “emerging growth company,” we will, among other things:
In addition, Section 107 of the JOBS Act provides that an emerging growth company can use the extended transition period provided in Section 7(a)(2)(B) of the Securities Act for complying with new or revised accounting standards. This permits an emerging growth company to delay the adoption of certain accounting standards until those standards would otherwise apply to private companies. We have elected to use this extended transition period and, as a result, our consolidated and combined financial statements may not be comparable to the financial statements of issuers who are required to comply with the effective dates for new or revised accounting standards that are applicable to other public companies.
We cannot predict if investors will find our Class A common stock less attractive as a result of our decision to take advantage of some or all of the reduced disclosure requirements above. If some investors find our Class common stock less attractive as a result, there may be a less active trading market for our Class A common stock and our stock price may be more volatile.
We may pay dividends to our stockholders, but our ability to do so is subject to the discretion of our board of directors and may be limited by our holding company structure and applicable provisions of Delaware law.
Our intention is to pay to holders of Class A common stock a quarterly dividend representing substantially all of Bridge Investment Group Holdings Inc.’s share of Distributable Earnings, subject to adjustment by amounts determined by our board of directors to be necessary or appropriate to provide for the conduct of our business, to make appropriate investments in our business and funds, to comply with applicable law, any of our debt instruments or other agreements, or to provide for future cash requirements such as tax-related payments and clawback obligations. All of the foregoing is subject to the qualification that the declaration and payment of any dividends are at the sole discretion of our board of directors and our board of directors may change our dividend policy at any time, including, without limitation, to reduce such quarterly dividends or even to eliminate dividends entirely. Any decision to declare and pay dividends in the future is made at the discretion of our board of directors and will depend on, among other things, general and economic conditions, our results of operations and financial condition, our available cash and current and anticipated cash needs, capital requirements, contractual, legal, tax and regulatory restrictions, and such other factors that our board of directors may deem relevant. In addition, our ability to pay dividends is, and may be, limited by covenants of existing and any future outstanding indebtedness we or our subsidiaries incur, including under our credit facilities. Therefore, any return on investment in our Class A common stock is solely dependent upon the appreciation of the price of our Class A common stock on the open market, which may not occur.
39
In addition, as a holding company, we will be dependent upon the ability of the Operating Company to generate earnings and cash flows and distribute them to us so that we may pay our obligations and expenses (including our taxes and payments under the Tax Receivable Agreement) and pay dividends to our stockholders. Our ability to declare and pay dividends to our stockholders is also subject to Delaware law (which may limit the amount of funds available for dividends). If, as a consequence of these various limitations and restrictions, we are unable to generate sufficient distributions from our business, we may not be able to make, or may be required to reduce or eliminate, the payment of dividends on our Class A common stock.
Our amended and restated certificate of incorporation provides that the Court of Chancery of the State of Delaware is the sole and exclusive forum for certain stockholder litigation matters and the federal district courts of the United States shall be the exclusive forum for the resolution of any complaint asserting a cause of action arising under the Securities Act, which could limit our stockholders’ ability to obtain a favorable judicial forum for disputes with us or our directors, officers, employees or stockholders.
Our amended and restated certificate of incorporation provides (A) (i) any derivative action or proceeding brought on behalf of the Company, (ii) any action asserting a claim of breach of a fiduciary duty owed by any current or former director, officer, other employee or stockholder of the Company to the Company or the Company’s stockholders, (iii) any action asserting a claim arising pursuant to any provision of the Delaware General Corporation Law, or the DGCL, our amended and restated certificate of incorporation or our amended and restated bylaws (as either may be amended or restated) or as to which the DGCL confers jurisdiction on the Court of Chancery of the State of Delaware or (iv) any action asserting a claim governed by the internal affairs doctrine of the law of the State of Delaware shall, to the fullest extent permitted by law, be exclusively brought in the Court of Chancery of the State of Delaware or, if such court does not have subject matter jurisdiction thereof, the federal district court of the State of Delaware; and (B) the federal district courts of the United States shall be the exclusive forum for the resolution of any complaint asserting a cause of action arising under the Securities Act. Notwithstanding the foregoing, the exclusive forum provision shall not apply to claims seeking to enforce any liability or duty created by the Exchange Act as the Exchange Act provides that federal courts are the sole forum for claims under the Exchange Act. The choice of forum provision may limit a stockholder’s ability to bring a claim in a judicial forum that it finds favorable for disputes with us or our directors, officers, or other employees, which may discourage such lawsuits against us and our directors, officers, and other employees, although our stockholders will not be deemed to have waived our compliance with federal securities laws and the rules and regulations thereunder. Alternatively, if a court were to find the choice of forum provision contained in our amended and restated certificate of incorporation to be inapplicable or unenforceable in an action, we may incur additional costs associated with resolving such action in other jurisdictions, which could harm our business, results of operations, and financial condition. Any person or entity purchasing or otherwise acquiring any interest in shares of our capital stock shall be deemed to have notice of and consented to the forum provisions in our amended and restated certificate of incorporation.
Our amended and restated certificate of incorporation provides that the doctrine of “corporate opportunity” will not apply with respect to any director or stockholder who is not employed by us or our subsidiaries.
The doctrine of corporate opportunity generally provides that a corporate fiduciary may not develop an opportunity using corporate resources, acquire an interest adverse to that of the corporation or acquire property that is reasonably incident to the present or prospective business of the corporation or in which the corporation has a present or expectancy interest, unless that opportunity is first presented to the corporation and the corporation chooses not to pursue that opportunity. The doctrine of corporate opportunity is intended to preclude officers or directors or other fiduciaries from personally benefiting from opportunities that belong to the corporation. Our amended and restated certificate of incorporation provides that the doctrine of “corporate opportunity” will not apply with respect to any director or stockholder who is not employed by us or our subsidiaries. Any director or stockholder who is not employed by us or our subsidiaries will, therefore, have no duty to communicate or present corporate opportunities to us, and will have the right to either hold any corporate opportunity for their (and their affiliates’) own account and benefit or to recommend, assign or otherwise transfer such corporate opportunity to persons other than us, including to any director or stockholder who is not employed by us or our subsidiaries.
As a result, certain of our stockholders, directors and their respective affiliates are not prohibited from operating or investing in competing businesses. We, therefore, may find ourselves in competition with certain of our stockholders, directors or their respective affiliates, and we may not have knowledge of, or be able to pursue, transactions that could potentially be beneficial to us. Accordingly, we may lose a corporate opportunity or suffer competitive harm, which could negatively impact our business, operating results and financial condition.
40
Future sales, or the perception of future sales, by us or our existing stockholders in the public market could cause the market price for our Class A common stock to decline.
The sale of shares of our Class A common stock in the public market, or the perception that such sales could occur, could harm the prevailing market price of shares of our Class A common stock. These sales, or the possibility that these sales may occur, also might make it more difficult for us to sell equity securities in the future at a time and at a price that we deem appropriate.
As of December 31, 2021, we have outstanding a total of 25,159,799 shares of Class A common stock. Of the outstanding shares, 2,860,649 shares of Class A common stock are held by our “affiliates,” as that term is defined in Rule 144 under the Securities Act, or subject to the lockup agreements described below. Any shares of Class A common stock held by our affiliates are eligible for resale pursuant to Rule 144 under the Securities Act, subject to the volume, manner of sale, holding period and other limitations of Rule 144 and any applicable lockup agreements.
At our initial public offering, substantially all of our stockholders agreed to customary lockup agreements with the underwriters of our initial public offering, which lockup restrictions expired 180 days following the completion of our initial public offering.
In addition, our employees have agreed that, without the prior written consent of a majority of our board of directors and subject to previously existing pledges, they will not: (1) sell, transfer, assign, gift, bequest or dispose by any other means, whether for value or no value and whether voluntary or involuntary or (2) grant a security interest, lien, charge, claim, community or other marital property interest, pledge, alienate, mortgage, option, hypothecate, encumber or make a similar collateral assignment by any other means, whether for value or no value and whether voluntary or involuntary, or grant any other restriction on use, voting (excluding any voting rights or proxies granted pursuant to the Stockholders Agreement), transfer, receipt of income or exercise of any other attribute of ownership on any of the LLC Interests, shares of our Class A common stock and shares of our Class B common stock (or beneficial interest therein), issued and outstanding upon the completion of our initial public offering (other than any restricted shares or issuer-directed shares purchased in this offering or in the open market in accordance with our insider trading or other applicable policy, and after giving effect to any shares sold by such employee in this offering) beneficially owned by such employee, or the existing interests. Such restrictions will cease to apply to our employees, other than Robert Morse, Jonathan Slager, Adam O’Farrell, Dean Allara and Chad Briggs, commencing on or after the first anniversary of the completion of this offering. Such restrictions cease to apply to our employees upon termination of their employment with the Company.
The restrictions described in the immediately preceding paragraph will cease to apply to Messrs. Morse, Slager, O’Farrell, Allara and Briggs as follows:
(a) on or after the first anniversary of the completion of our initial public offering, each of Messrs. Morse, Slager, O’Farrell, Allara and Briggs may transfer or encumber up to one-third of his vested existing interests;
(b) on or after the second anniversary of the completion of our initial public offering, each of Messrs. Morse, Slager, O’Farrell, Allara and Briggs may transfer or encumber up to two-thirds of his vested existing interests; and
(c) on or after the third anniversary of the completion of our initial public offering, each of Messrs. Morse, Slager, O’Farrell, Allara and Briggs may transfer or encumber all of his vested existing interests.
Upon the effective date of his expected retirement, which is expected to be May 31, 2022, Mr. Briggs will no longer be subject to the ongoing restrictions and he will be able to transfer or encumber all of his vested existing interests. Upon the expiration of the applicable lock-up periods, substantially all of the shares subject to such lock-up restrictions will become eligible for sale, subject to the limitations discussed above. The market price of our shares of Class A common stock could drop significantly if the holders of these shares sell them or are perceived by the market as intending to sell them. These factors could also make it more difficult for us to raise additional funds through future offerings of our shares of Class A common stock or other securities.
In addition, any Class A common stock that we issue under the 2021 Incentive Award Plan or other equity incentive plans that we may adopt in the future would dilute the percentage ownership held by the investors who purchase our Class A common stock.
In the future, we may also issue securities in connection with investments, acquisitions or capital raising activities. In particular, the number of shares of our Class A common stock issued in connection with an investment or acquisition, or to raise additional equity capital, could constitute a material portion of our then-outstanding shares of our Class A common stock. Any such issuance of additional securities in the future may result in additional dilution to you, or may adversely impact the price of our Class A common stock.
41
General Risk Factors
The United Kingdom’s withdrawal from the European Union may have a negative effect on global economic conditions, financial markets and our business.
Following a national referendum and enactment of legislation by the government of the United Kingdom, the United Kingdom formally withdrew from the European Union and ratified a trade and cooperation agreement governing its future relationship with the European Union. The agreement, which is being applied provisionally from January 1, 2021 until it is ratified by the European Parliament and the Council of the European Union, addresses trade, economic arrangements, law enforcement, judicial cooperation and a governance framework including procedures for dispute resolution, among other things. Because the agreement merely sets forth a framework in many respects and will require complex additional bilateral negotiations between the United Kingdom and the European Union as both parties continue to work on the rules for implementation, significant political and economic uncertainty remains about how the precise terms of the relationship between the parties will differ from the terms before withdrawal.
These developments, or the perception that any related developments could occur, have had and may continue to have a material adverse effect on global economic conditions and financial markets, and may significantly reduce global market liquidity, restrict the ability of key market participants to operate in certain financial markets or restrict our access to capital. Any of these factors could have a material adverse effect on our business, financial condition and results of operations and reduce the price of Class A common stock.
We incur significant costs as a result of operating as a public company.
As a publicly traded company, we are subject to the reporting requirements of the Exchange Act, the Sarbanes-Oxley Act, the Dodd-Frank Act, the listing requirements of the NYSE and other applicable securities laws and regulations. The expenses we incur as a public company for reporting and corporate governance purposes have been increasing and may continue to increase. These rules and regulations have and will continue to increase our legal and financial compliance costs and make some activities more difficult, time-consuming and costly. Furthermore, if we are unable to satisfy our obligations as a public company, we could be subject to delisting of our Class A common stock, fines, sanctions and other regulatory action and potentially civil litigation. These factors may, therefore, strain our resources, divert management’s attention and affect our ability to attract and retain qualified board members.
As a public reporting company, we are subject to the NYSE rules and the rules and regulations established from time to time by the SEC regarding our internal control over financial reporting. If we fail to maintain effective internal control over financial reporting and disclosure controls and procedures, we may not be able to accurately report our financial results or report them in a timely manner.
The NYSE rules and the rules and regulations established from time to time by the SEC require, among other things, that we establish and periodically evaluate our procedures with respect to our internal control over financial reporting. Reporting obligations as a public company place a considerable strain on our financial and management systems, processes and controls, as well as on our personnel.
In addition, we are required to document and test our internal control over financial reporting pursuant to Section 404 of the Sarbanes-Oxley Act so that our management can certify as to the effectiveness of our internal control over financial reporting by the time our second annual report is filed with the SEC and thereafter, which requires us to document and make significant changes to our internal control over financial reporting. Likewise, our independent registered public accounting firm will be required to provide an attestation report on the effectiveness of our internal control over financial reporting at such time as we cease to be an “emerging growth company,” as defined in the JOBS Act, and we become an accelerated or large accelerated filer. As described above, we could potentially qualify as an “emerging growth company” until as late as the fifth anniversary of our initial public offering.
We have and expect to continue to incur costs related to implementing an internal audit and compliance function to further improve our internal control environment. If we identify future deficiencies in our internal control over financial reporting or if we are otherwise unable to comply with the demands placed upon us as a public company, including the requirements of Section 404 of the Sarbanes-Oxley Act, in a timely manner, we may be unable to accurately report our financial results, or report them within the timeframes required by the SEC. We also could become subject to sanctions or investigations by the SEC or other regulatory authorities. In addition, if we are unable to assert that our internal control over financial reporting is effective, or if our independent registered public accounting firm is unable to express an opinion as to the effectiveness of our internal control over financial reporting, when required, investors may lose confidence in the accuracy and completeness of our financial reports, we may face restricted access to the capital markets and our stock price may be adversely affected.
42
If securities analysts do not publish research or reports about our business or if they downgrade our stock or our sector, or if there is any fluctuation in our credit rating, our stock price and trading volume could decline.
The trading market for our Class A common stock relies in part on the research and reports that industry or financial analysts publish about us or our business. We do not control these analysts. If one or more of the analysts who do cover us stops covering us or fails to publish reports on us regularly, we could lose visibility in the market, which, in turn, could cause our stock price or trading volume to decline. Furthermore, if one or more of the analysts who do cover us downgrades our stock or our industry, or the stock of any of our competitors, or publishes inaccurate or unfavorable research about our business, the price of our stock could decline.
Additionally, any fluctuation in the credit rating of us or our subsidiaries may impact our ability to access debt markets in the future or increase our cost of future debt, which could have a material adverse effect on our operations and financial condition, which in return may adversely affect the trading price of shares of our Class A common stock.
Certain provisions of Delaware law and antitakeover provisions in our organizational documents could delay or prevent a change of control.
Certain provisions of Delaware law and our amended and restated certificate of incorporation and amended and restated bylaws may have an antitakeover effect and may delay, defer, or prevent a merger, acquisition, tender offer, takeover attempt or other change of control transaction that a stockholder might consider in its best interest, including those attempts that might result in a premium over the market price for the shares held by our stockholders. These provisions provide for, among other things:
These antitakeover provisions could make it more difficult for a third-party to acquire us, even if the third-party’s offer may be considered beneficial by many of our stockholders. As a result, our stockholders may be limited in their ability to obtain a premium for their shares.
In addition, we have opted out of Section 203 of the General Corporation Law of the State of Delaware, which we refer to as the DGCL, but our amended and restated certificate of incorporation provides that engaging in any of a broad range of business combinations with any “interested” stockholder (any stockholder with 15% or more of our voting stock) for a period of three years following the time at which the stockholder became an “interested” stockholder is prohibited, provided, however, that, under our amended and restated certificate of incorporation, the Operating Company, Robert Morse and any of their respective affiliates will not be deemed to be interested stockholders regardless of the percentage of our outstanding voting stock owned by them, and accordingly will not be subject to such restrictions.
43
Climate change may adversely impact the properties owned by our funds and may lead to additional compliance obligations and costs as well as additional taxes and fees.
We face both physical climate change risks, such as increasing temperatures, rising sea levels, changing weather patterns and more frequent or intense droughts, floods and storms, and transition climate change risks, such as new or changing land use policies, carbon emissions regulations, water conservation regulations, reporting requirements, technology standards and market trends. We cannot predict with certainty the extent, rate, or impact of climate change or the measures that governmental authorities or others may implement to address climate change. The potential impacts of climate change on our operations are highly uncertain and will vary across the geographies in which we operate and where our funds own properties. Such impacts may result in stranded assets and volatile or decreased demand at certain of the properties owned by our funds. Climate change may also have indirect effects on our business by, among other things, increasing the cost of insurance or making insurance unavailable for certain properties, disrupting supply chains, and driving population migration to or away from certain properties. Although we strive to identify, analyze, and respond to the risk and opportunities that climate change presents, at this time, there can be no assurance that climate change will not have an adverse effect on the value of the properties owned by our funds and our financial performance.
We may become subject to new or changing laws or regulations related to climate change, which could adversely impact our business, results of operations and financial condition. The federal government and certain state and local governments have enacted or proposed climate change laws and regulations, including in jurisdictions in which we or our funds own properties. These laws and regulations could result in increased litigation risk and substantial costs, including compliance costs, energy costs, retrofit costs, construction costs, monitoring and reporting costs, capital expenditures for environmental control facilities and other additional costs for the properties owned by our funds. These increased costs could negatively impact the investment returns of our funds, which would impact the financial condition of our business. Furthermore, our reputation could be negatively affected if we violate climate change laws or regulations or our stated ESG, sustainability or responsible investment principles. We cannot predict how future laws and regulations, or future interpretations of current laws and regulations, related to climate change will affect the properties owned by our funds, our business, results of operations and financial condition.
We are subject to increasing scrutiny with respect to climate change and the environmental, social and governance impact of investments made by our funds, which may constrain investment opportunities for our funds and adversely affect our ability to raise capital.
In recent years, some investors have placed increasing emphasis on the negative impacts of investments made by the private equity and other funds to which they commit capital, including with respect to environmental, social and governance (“ESG”) matters. Investors may demonstrate increased activism with respect to existing investments, including by urging asset managers to take certain actions that could adversely impact the value of an investment, or refrain from taking certain actions that could improve the value of an investment. In some cases, investors have conditioned future capital commitments on the taking or refraining from taking of such actions. Increased focus and activism related to ESG and similar matters may constrain our capital deployment opportunities, and the demands of certain investors may further limit the types of investments that are available to our funds. In addition, investors may decide to withdraw previously committed capital from our funds (where such withdrawal is permitted) or to not commit capital to future fundraises as a result of their assessment of our approach to and consideration of the social cost of investments made by our funds. To the extent our access to capital from investors is impaired, we may not be able to maintain or increase the size of our funds or raise sufficient capital for new funds, which may adversely impact our revenues.
In addition, ESG matters have been the subject of increased focus by certain governmental authorities and regulators in the United States and in the EU. For example, in May 2018, the European Commission proposed legislative reforms relating in part to formalizing the duties and disclosure obligations of companies, asset managers and asset owners in relation to ESG factors. More recently, in March 2021, the SEC announced the creation of the Climate and ESG Task Force in the Division of Enforcement, which will analyze disclosure and compliance issues relating to investment advisers’ and funds’ ESG strategies, and, in June 2021, the SEC included several ESG matters in the 2021 Unified Agenda of Regulatory and Deregulatory Actions. As a result of these and other related initiatives, we may be required to provide additional disclosure to investors in our funds with respect to ESG matters.
Item 1B. Unresolved Staff Comments
Not applicable.
44
Item 2. Properties
We are headquartered in Salt Lake City, Utah. Our other principal operations are located in New York, New York; San Mateo, California; Orlando, Florida; Atlanta, Georgia; Charlotte, North Carolina; and Arlington, Virginia. We lease each of these offices. We consider these facilities to be suitable and adequate for the management and operations of our business and believe that we should be able to renew our leases or secure similar property without an adverse impact on our operations.
Item 3. Legal Proceedings
We may from time to time be involved in litigation and claims incidental to the conduct of our business. Our businesses are also subject to extensive regulation, which may result in regulatory proceedings against us. We are not currently subject to any pending legal proceeding (including judicial, regulatory, administrative or arbitration) that we expect to have a material impact on our business, consolidated financial statements or results of operations.
Item 4. Mine Safety Disclosures
Not applicable.
45
PART II
Item 5. Market for Registrant's Common Equity, Related Stockholder Matters and Issuer Purchases of Equity Securities
Common Stock
Overview
Our Class A common stock is traded on the NYSE under the symbol “BRDG.” There is no established public trading market for our Class B common stock. The last reported sale price of our Class A common stock on the NYSE on March 1, 2022 was $20.50 per share. As of March 1, 2022, there were 62 holders of record of our Class A common stock and 80 holders of our Class B common stock. The actual number of stockholders is greater than this number of record holders and includes stockholders who are beneficial owners but whose shares are held in street name by brokers and other nominees.
Dividend Policy
In December 2021, the Company declared and paid a quarterly dividend of $0.24 per share of Class A common stock totaling $6.0 million. In March 2022, the Company declared a quarterly dividend of $0.21 per share on its Class A common stock payable on March 25, 2022, to common stockholders of record as of the close of business on March 11, 2022. We expect to continue our policy of paying regular cash dividends on a quarterly basis, although there is no assurance as to the existence or amount of future dividends because they may be influenced by future earnings, including earnings of equity method investees, capital requirements, financial conditions, and regulatory approvals.
Our intention is to pay to holders of Class A common stock a quarterly dividend representing substantially all of Bridge Investment Group Holdings Inc.’s share of Distributable Earnings attributable to the Operating Company, subject to adjustment by amounts determined by our board of directors to be necessary or appropriate to provide for the conduct of our business, to make appropriate investments in our business and funds, to comply with applicable law, any of our debt instruments or other agreements, or to provide for future cash requirements such as tax-related payments and clawback obligations.
For Bridge’s definition of Distributable Earnings, see “Management’s Discussion and Analysis of Financial Condition and Results of Operation—Non-GAAP Financial Measures.”
All of the foregoing is subject to the qualification that the declaration and payment of any dividends are at the sole discretion of our board of directors and our board of directors may change our dividend policy at any time, including, without limitation, to reduce such quarterly dividends or even to eliminate such dividends entirely.
Holders of our Class B common stock are not entitled to participate in any dividends declared by our board of directors. Furthermore, because we are a holding company, our ability to pay cash dividends on our Class A common stock depends on our receipt of cash distributions from the Operating Company and, through the Operating Company, cash distributions and dividends from our other direct and indirect subsidiaries. Our ability to pay dividends may be restricted by the terms of any future credit agreement or any future debt or preferred equity securities of us or our subsidiaries. See “Management’s Discussion and Analysis of Financial Condition and Results of Operation—Liquidity and Capital Resources.” Any future determination as to the declaration and payment of dividends, if any, will be at the discretion of our board of directors, subject to compliance with contractual restrictions and covenants in the agreements governing our current and future indebtedness. Any such determination will also depend upon our business prospects, results of operations, financial condition, cash requirements and availability, debt repayment obligations, capital expenditure needs, contractual restrictions, covenants in the agreements governing our current and future indebtedness, industry trends, the provisions of Delaware law affecting the payment of dividends to stockholders and any other factors our board of directors may consider relevant.
We are holding company, and our principal asset are the Class A Units we own in our Operating Company. If we decide to pay a dividend in the future, we would need to cause the Operating Company to make distributions to us in an amount sufficient to cover such dividend. If the Operating Company makes such distributions to us, the other holders of Class A Units will be entitled to receive pro rata distributions. See “Risk Factors—Risks Related to Our Organizational Structure—Our principal asset after the completion of this offering will be our interest in the Operating Company, and, as a result, we will depend on distributions from the Operating Company to pay our taxes and expenses, including payments under the Tax Receivable Agreement, and to pay dividends to holders of our Class A common stock. The Operating Company’s ability to make such distributions may be subject to various limitations and restrictions.”
46
Stock Performance Graph
The following performance graph and related information shall not be deemed “soliciting material” or to be “filed” with the SEC, nor shall such information be incorporated by reference into any of the Company’s filings under the Securities Act or the Exchange Act. The following performance shown in the graph below is not intended to forecast or be indicative of future stock price performance.
The following graph compares the total cumulative stockholder return of our Class A common stock from July 16, 2021, the first day of trading of our Class A common stock on the NYSE, through December 31, 2021, relative to the performance of the S&P 500 Index and the Dow Jones U.S. Asset Managers Index. The graph assumes an initial investment of $100 at the close of trading on July 16, 2021 and that all dividends paid by Bridge Investment Group Holdings Inc. and companies included in these indices have been reinvested.
|
July 16, 2021 |
|
December 31, 2021 |
|
||
Bridge Investment Group Holdings Inc. |
$ |
100 |
|
$ |
161 |
|
Dow Jones U.S. Asset Managers Index |
$ |
100 |
|
$ |
111 |
|
S&P 500 Index |
$ |
100 |
|
$ |
111 |
|
Unregistered Sales of Equity Securities
There were no unregistered equity securities sold from January 1, 2021 to December 31, 2021, other than as previously disclosed in our quarterly reports on Form 10-Q and current reports on Form 8-K.
Securities Authorized for Issuance Under Equity Compensation Plans
The information contained in Item 12 of the Form 10-K is incorporated by reference herein.
Item 6. Reserved
47
Item 7. Management’s Discussion and Analysis of Financial Condition and Results of Operations
This section presents management’s perspective on our financial condition and results of operations. The following discussion and analysis is intended to highlight and supplement data and information presented elsewhere in this annual report on Form 10-K, including the consolidated and combined financial statements and related notes, and should be read in conjunction with the accompanying tables. To the extent that this discussion describes prior performance, the descriptions relate only to the periods listed, which may not be indicative of our future financial outcomes. In addition to historical information, this discussion contains forward-looking statements that involve risks, uncertainties and assumptions that could cause results to differ materially from management’s expectations. Factors that could cause such differences are discussed in the sections titled “Cautionary Note Regarding Forward-Looking Statements” and “Risk Factors.” We assume no obligation to update any of these forward-looking statements. In addition, amounts and percentages in the tables below may reflect rounding adjustments and consequently totals may not appear to sum.
Overview
We are a leading, vertically integrated real estate investment manager, diversified across specialized asset classes, with approximately $36.3 billion of assets under management, or AUM, as of December 31, 2021. Our ability to scale our specialized and operationally driven investment approach across multiple attractive sectors within real estate equity and debt, in a way that creates sustainable and thriving communities, is the ethos of who we are and the growth engine of our success. We have enjoyed significant growth since our establishment as an institutional fund manager in 2009, driven by strong investment returns, and our successful efforts to develop an array of investment platforms focused on sectors of the U.S. real estate market that we believe are the most attractive. We have extensive multi-channel distribution capabilities and currently manage capital on behalf of more than 180 global institutions and more than 10,000 individual investors across our investment strategies.
In December 2021, we announced that we had entered into definitive agreements to acquire certain assets of Gorelick Brothers Capital (“GBC”), including a 60% interest in GBC’s asset and property management business. The 60% interest in GBC’s asset and property management business was acquired by our Operating Company for $30 million (total implied value of $50 million) with 50% paid in cash and 50% with Class A Units of the Operating Company. Upon consummation of the transaction, (i) the GBC team and Bridge launched a single-family rental (“SFR”) strategy on the Bridge platform, (ii) Bridge and the former key principals of GBC formed and jointly own a new single-family rental investment manager within Bridge, and (iii) Bridge and the former GBC principals completed a $660 million recapitalization of a portfolio comprising more than 2,700 homes in 14 markets, concentrated in the Sunbelt and certain Midwest markets of the United States. Upon closing of the transaction on January 31, 2022, our Operating Company now indirectly owns a majority of the newly created Bridge Single-family rental investment manager, and the former principals of GBC own the remaining 40%. See Note 25, “Subsequent Events,” to our consolidated and combined financial statements for additional information on this transaction.
Also in December 2021, we announced that our value-add logistics strategy formed a joint venture with the Townsend Group (“Townsend”) to deploy as much as $400 million to acquire, develop, and operate global gateway institutional logistics assets within the United States.
Trends Affecting Our Business
Our business is affected by a variety of factors, including conditions in the financial markets and economic and political conditions. Changes in global economic conditions and regulatory or other governmental policies or actions can materially affect the values of our holdings and the ability to source attractive investments and completely deploy the capital that we have raised. However, we believe our disciplined investment philosophy across our diversified investment strategies has historically contributed to the stability of our performance throughout market cycles.
In addition to these macroeconomic trends and market factors, our future performance is heavily dependent on our ability to attract new capital, generate strong, stable returns, source investments with attractive risk-adjusted returns and provide attractive investment products to a growing investor base. We believe our future performance will be influenced by the following factors:
48
Impact of COVID-19
In March 2020, the World Health Organization declared the outbreak of COVID-19 a global pandemic. The spread of COVID-19 throughout the world led many countries to institute a variety of measures to contain the viral spread, which led to significant disruption and uncertainty in the global financial markets. While many of the initial restrictions in the United States have been relaxed or lifted in an effort to generate more economic activity, the risk of future outbreaks of COVID-19, or variants thereof, or of other public health crises remain, and some restrictions remain in place and lifted restrictions may be reimposed to mitigate risks to public health in jurisdictions where additional outbreaks have been detected. Moreover, even where restrictions are and remain lifted, the timing and effectiveness of vaccine distribution and other factors could lead people to continue to self-isolate and not participate in the economy at pre-pandemic levels for a prolonged period of time, potentially further delaying global economic recovery.
49
We continue to closely monitor developments related to COVID-19 and assess any negative impacts to our business. The COVID-19 pandemic has affected, and may further affect, our business in various ways. In particular, it is possible that our future results may be adversely affected by slowdowns in fundraising activity, the pace of capital deployment and the expansion of our tenant base and our ability to collect rental income when due. See “Risk Factors—Risks Related to Our Industry—The COVID-19 pandemic has caused severe disruptions in the U.S. and global economy, may affect the investment returns of our funds, has disrupted, and may continue to disrupt, industries in which we and our funds operate and could potentially negatively impact us or our funds.”
Countries around the world continue to recover from the economic impacts of the COVID-19 pandemic. While economic activity remains robust, global supply chain disruptions, labor shortages and rising commodity prices continue to have a negative impact across sectors and regions, and concerns regarding inflation and increasing interest rates are deepening.
Segments
We operate as one business, a fully integrated real estate investment manager. Our chief operating decision maker, which is the executive chairman, utilizes a consolidated approach to assess financial performance and allocate resources. As such, we operate in one business segment.
Key Financial Measures
Our key financial and operating measures are discussed below. Additional information regarding our significant accounting policies can be found in Note 2, “Significant Accounting Policies,” to our consolidated and combined financial statements, which appear elsewhere in this annual report on Form 10-K.
Revenues
Fund Management Fees. Our Fund Management fees are generally based on a defined percentage of total commitments, invested capital, or net asset value (“NAV”) of the investment portfolios that we manage. Generally, with respect to fund management fees charged on committed capital, fund management fees are earned at the management fee rate on committed capital and, beginning at the expiration of the investment period, on invested capital. The majority of our fee-earning AUM pays fees on committed capital during the respective funds’ investment periods, which generally produces more management fee revenue than fees paid on invested capital. The fees are generally based on a quarterly measurement period and paid in advance. We typically share a portion of the fees we earn on capital raised through wirehouse and distribution channels. Fund management fees are recognized as revenue in the period in which advisory services are rendered, subject to our assessment of collectability. As of December 31, 2021, our weighted-average management fee varies by fund and is based upon the size of the commitment; however, the low average for a single fund is 0.96% and the high average for a single fund is 1.99% of committed or invested capital for our closed-end funds. Fund management fees also includes management fees for joint ventures and separately managed assets. Management fees for those types of assets is usually less than 1% and typically charged on invested capital or invested equity. For our sponsored closed-end funds, our capital raising period is traditionally 18 to 24 months. After the initial closing of a closed-end fund, we charge catch-up management fees to investors who subscribe in subsequent closings in amounts equal to the fees they would have paid if they had subscribed in the initial closing plus interest. Catch-up management fees are recognized in the period in which the investor subscribes to the fund. Fund management fees are presented net of placement agent fees, where we are acting as an agent in the arrangement.
Property Management and Leasing Fees. We have vertically integrated platforms where we operate a significant percentage of the real estate properties owned by our funds. As of December 31, 2021, we managed approximately 100% of the multifamily properties, 93% of the workforce and affordable housing properties, 80% of the office properties, and 30% of the seniors housing properties owned by our funds. We also provide property management services for a limited number of third-party owned assets. These fees are based upon cash collections at the managed properties and traditionally range from 2.5% to 3.5% for multifamily assets, 2% to 3% for office assets and 4% to 5% for seniors housing assets. Additionally, we receive leasing fees upon the execution of a leasing agreement for our office assets. We determined that certain third-party asset management costs, for which we are deemed to be the primary obligor, are recorded as gross revenue with a corresponding expense. The gross presentation has no impact on our net income to the extent the expense incurred, and corresponding cost reimbursement income are recognized, in the same period. The offset is recorded in third-party operating expenses on the consolidated and combined statement of operations.
Construction Management Fees and Development Fees. The majority of our equity funds have a value-add component, where we seek to make improvements or reposition the properties, or have a development strategy. Similar to Property Management Fees, we perform the construction management and development management for certain managed properties and receive fees for these services. These fees are earned as the work is completed. The rates used are based upon market rates and are updated on an annual basis. For small projects, we occasionally charge an immaterial flat fee. For significant projects, the range is generally 0.5% to 5.0% of construction costs.
50
Transaction Fees. We earn transaction fees associated with the due diligence related to the acquisition of assets and origination of debt financing for assets. The fee is recognized upon the acquisition of the asset or origination of the mortgage or other debt. In 2021, the fee range for acquisition fees was 0.5% to 1.0% of the gross acquisition cost of the investment or, in the case of development projects, the total development budget, and the fee range for debt origination was 0.3% to 1.0% of the acquisition price of the real estate acquired or value of the mortgage.
Insurance Premiums. BIGRM is our subsidiary that provides certain insurance products for multifamily and commercial properties owned by the funds. BIGRM insures direct risks including lease security deposit fulfillment, tenant legal liability, workers compensation deductible, property deductible and general liability deductible reimbursements. Tenant legal liability premiums are earned monthly. Deposit eliminator premiums are earned in the month that they are written. Workers’ compensation and property deductible premiums are earned over the terms of the policy period.
Other Asset Management and Property Income. Other asset management and property income is comprised of, among other things, interest on catch-up management fees, fees related to in-house legal and tax professional fees, which is generally billed on an hourly rate to various Bridge funds and properties, fund administration fees, and other miscellaneous fees.
Performance Fees. We earn two types of performance fee revenues: incentive fees and performance allocations, as described below. Incentive fees comprise fees earned from certain fund investor investment mandates for which we do not have a general partner interest in a fund. Performance allocations include the allocation of performance-based fees, commonly referred to as carried interest, from limited partners in the funds to us. As of December 31, 2021, we had approximately $13.3 billion of carry-eligible capital across approximately 41 funds and other vehicles, of which 21 were in accrued carried interest positions.
Incentive fees are generally calculated as a percentage of the profits earned with respect to certain accounts for which we are the investment manager, subject to the achievement of minimum return levels or performance benchmarks. Incentive fees are a form of variable consideration and represent contractual fee arrangements in our contracts with our customers. Incentive fees are typically subject to reversal until the end of a defined performance period, as these fees are affected by changes in the fair value of the assets under management or advisement over such performance period. Moreover, incentive fees that are received prior to the end of the defined performance period are typically subject to clawback, net of tax. We recognize incentive fee revenue only when these amounts are realized and no longer subject to significant reversal, which is typically at the end of a defined performance period and/or upon expiration of the associated clawback period (i.e., crystallization). However, clawback terms for incentive fees received prior to crystallization only require the return of amounts on a net of tax basis. Accordingly, the tax basis portion of incentive fees received in advance of crystallization is not subject to clawback and is therefore recognized as revenue immediately upon receipt. Incentive fees received in advance of crystallization that remain subject to clawback are recorded as deferred incentive fee revenue and included in accrued performance allocations compensation in the consolidated and combined balance sheets.
Performance allocations include the allocation of performance-based fees to us from limited partners in the funds in which we hold an equity interest. We are entitled to a performance allocation (typically 15% to 20%) based on cumulative fund or account performance to date, irrespective of whether such amounts have been realized. These performance allocations are subject to the achievement of minimum return levels (typically 6% to 8%), in accordance with the terms set forth in the respective fund’s governing documents. We account for our investment balances in the funds, including performance allocations, under the equity method of accounting because we are presumed to have significant influence as the general partner or managing member. Accordingly, performance allocations are not deemed to be within the scope of Accounting Standards Codification Topic 606, or ASC 606, Revenue from Contracts with Customers. We recognize income attributable to performance allocations from a fund based on the amount that would be due to us pursuant to the fund’s governing documents, assuming the fund was liquidated based on the current fair value of its underlying investments as of that date. Accordingly, the amount recognized as performance allocation income reflects our share of the gains and losses of the associated fund’s underlying investments measured at their then-fair values, relative to the fair values as of the end of the prior period. We record the amount of carried interest allocated to us as of each period end as accrued performance allocations, which is included as a component of investments in the consolidated and combined balance sheets. Performance allocations are realized when an underlying investment is profitably disposed of and the fund’s cumulative returns are in excess of the specific hurdle rates, as defined in the applicable governing documents. Performance allocations are subject to reversal to the extent that the amount received to date exceeds the amount due to us based on cumulative results. As such, a liability is accrued for the potential clawback obligations if amounts previously distributed to us would require repayment to a fund if such fund were to be liquidated based on the current fair value of their underlying investments as of the reporting date. Actual repayment obligations generally do not become realized until the end of a fund’s life.
51
Expenses
Employee Compensation and Benefits. Compensation comprises salaries, bonuses (including discretionary awards), related benefits, share-based compensation, compensatory awards, and the cost of processing payroll. Bonuses are accrued over the employment period to which they relate.
Share-Based Compensation. To further align the interests of our employees with our shareholders and to cultivate a strong sense of ownership and commitment to our Company, certain employees also are eligible to receive unvested Class A restricted common stock (“Restricted Stock”), Restricted Stock Units (“RSUs”), profits interests awards and performance allocations. Equity-classified awards granted to employees that have a service condition only are measured at fair value at date of grant and remeasured at fair value only upon a modification of the award. The fair value of the Restricted Stock and RSUs is based upon our stock price at grant date. The fair value for profits interests awards classified as equity is determined using a Monte Carlo valuation on the grant date or date of remeasurement. We recognize compensation expense on a straight-line basis over the requisite service period of the awards not contingent on employment, with the amount of compensation expense recognized at the end of a reporting period at least equal to the fair value of the portion of the award that has vested through that date. Compensation expense is adjusted for actual forfeitures upon occurrence. See Note 22, “Share-Based Compensation and Profits Interests,” to our consolidated and combined financial statements for more information about equity awards.
Performance Allocations Compensation. Performance fee-related compensation deemed to be compensatory awards represents the portion of performance allocation revenue and incentive fees that have been awarded to employees as a form of long-term incentive compensation. Performance fee-related compensation is generally tied to the investment performance of the funds. Up to 60% of performance allocation revenue is awarded to employees as part of our long-term incentive compensation plan, fostering alignment of interest with our fund investors and investors, and retaining key investment professionals. Performance allocations related compensation is accounted for as compensation expense in conjunction with the related performance allocation revenue and, until paid, is recorded as a component of accrued performance allocations compensation in the consolidated and combined balance sheets. Amounts presented as realized indicate the amounts paid or payable to employees based on the receipt of performance allocation revenue from realized investment activity. Performance allocations related compensation expense may be subject to reversal to the extent that the related performance allocation revenue is reversed. Performance allocations related compensation paid to employees may be subject to clawback on an after-tax basis under certain scenarios. Incentive fee-related compensation is accrued as compensation expense when it is probable and estimable that payment will be made.
Loss and Loss Adjustment Expenses. Amount includes the estimated liability (based upon actuarial reports) of both losses which have been reported to us, but have not been processed and paid, and losses relating to insured events which have occurred but have not been reported to us.
Third-party Operating Expenses. Costs represents transactions, largely operation and leasing of assets, with third-party operators of real estate owned by the funds where we were determined to be the principal rather than the agent in the transaction.
General and Administrative Expenses. General and administrative expenses include costs primarily related to professional services, occupancy, travel, communication and information services, and other general operating items.
Depreciation and Amortization. Deprecation or amortization of tenant improvements, furniture and equipment and intangible assets is expensed on a straight-line basis over the useful life of the asset.
Other Income (Expense)
Investment Income (Loss). Realized investment income (loss) occurs when the Company redeems all or a portion of its investment or when the Company receives cash income, such as dividends or distributions. Unrealized investment income (loss) results from changes in the fair value of the underlying investment as well as from the reversal of previously recognized unrealized income (loss) at the time an investment is realized. The Company’s share of the investee’s income and expenses for the Company’s equity method investments (exclusive of carried interest) is also included within other investment income (loss). Investment income (loss) is presented together as realized and unrealized income (losses) in the consolidated and combined statements of operations. Finally, the realized and unrealized change in income (loss) associated with the financial instruments that we elect the fair value option is also included in realized and unrealized investment income (loss).
Interest Income. Interest (other than interest on catch-up management fees), dividends and other investment income are included in interest income. Interest income is recognized on an accrual basis to the extent that such amounts are expected to be collected using the effective interest method. Dividends and other investment income are recorded when the right to receive payment is established.
52
Other Income (Expense). Other income (expense) relates to non-operating and non-investment related expenses, which at times can include changes in our TRA liability.
Interest Expense. Interest expense includes interest related to our two tranches of privately offered notes, or the Private Placement Notes, which have a weighted-average fixed coupon rate of 4.025%, and our revolving credit facility, which has a variable interest rate of LIBOR plus 2.25%.
Income Tax Provision. Income tax expense consists of taxes paid or payable by us and our operating subsidiaries. Following our IPO, we are taxed as a corporation for U.S. federal and state income tax purposes and, as a result, are subject to U.S. federal and state income taxes, in addition to local and foreign income taxes, with respect to our allocable share of any taxable income generated by the Operating Company that will flow through to its members. The Operating Company has historically been treated as a partnership for U.S. federal and state income tax purposes. As such, income generated by the Operating Company flows through to its members and is generally not subject to U.S. federal or state income tax at the Operating Company level. Our non-U.S. subsidiaries operate as corporate entities in non-U.S. jurisdictions. Accordingly, in some cases, these entities are subject to local or non-U.S. income taxes. In addition, certain subsidiaries are subject to local jurisdiction taxes at the entity level, with the related tax provision reflected in the consolidated and combined statements of operations.
Net Income Attributable to Non-Controlling Interests in Bridge Investment Group Holdings LLC. Net Income Attributable to Non-Controlling Interests in Bridge Investment Group Holdings LLC represent the economic interests held by management and third parties in the consolidated subsidiaries of the Operating Company, fund manager entities, and employees in those entities. These non-controlling interests are allocated a share of income or loss in the respective consolidated subsidiary in proportion to their relative ownership interests, after consideration of contractual arrangements that govern allocations of income or loss.
Net Income Attributable to Non-Controlling Interests in Bridge Investment Group Holdings Inc. Net Income Attributable to Non-Controlling Interests in Bridge Investment Group Holdings Inc. represents the economic interests in the Operating Company held by the third-party owners of Class A Units of the Operating Company. Non-controlling interests in Bridge Investment Group Holdings Inc. are allocated a share of income or loss in the Operating Company in proportion to their relative ownership interests, after consideration of contractual arrangements that govern allocations of income or loss.
For additional discussion of components of our consolidated and combined financial statements, see Note 2, “Significant Accounting Policies,” to our consolidated and combined financial statements.
Operating Metrics
We monitor certain operating metrics that are either common to the asset management industry or that we believe provide important data regarding our business.
Assets Under Management
AUM refers to the assets we manage. Our AUM represents the sum of (a) the fair value of the assets of the funds and vehicles we manage, plus (b) the contractual amount of any uncalled capital commitments to those funds and vehicles (including our commitments to the funds and vehicles and those of Bridge affiliates). Our AUM is not reduced by any outstanding indebtedness or other accrued but unpaid liabilities of the assets we manage. We view AUM as a metric to measure our investment and fundraising performance as it reflects assets generally at fair value plus available uncalled capital. Our calculations of AUM and fee-earning AUM may differ from the calculations of other investment managers. As a result, these measures may not be comparable to similar measures presented by other investment managers. In addition, our calculation of AUM (but not fee-earning AUM) includes uncalled commitments to (and the fair value of the assets in) the funds and vehicles we manage from Bridge and Bridge affiliates, regardless of whether such commitments or investments are subject to fees. Our definition of AUM is not based on any definition contained in the agreements governing the funds and vehicles we manage or advise.
53
The table below presents rollforwards of our AUM for the years ended December 31, 2021, 2020, and 2019:
|
|
Year Ended December 31, |
|
|||||||||
(in millions) |
|
2021 |
|
|
2020 |
|
|
2019 |
|
|||
Balance as of beginning of year |
|
$ |
25,214 |
|
|
$ |
20,298 |
|
|
$ |
14,491 |
|
New capital / commitments raised(1) |
|
|
5,161 |
|
|
|
2,530 |
|
|
|
3,738 |
|
Distributions / return of capital(2) |
|
|
(1,196 |
) |
|
|
(1,819 |
) |
|
|
(75 |
) |
Change in fair value and acquisitions(3) |
|
|
7,136 |
|
|
|
4,205 |
|
|
|
2,144 |
|
AUM as of end of year |
|
$ |
36,315 |
|
|
$ |
25,214 |
|
|
$ |
20,298 |
|
Increase |
|
|
11,101 |
|
|
|
4,916 |
|
|
|
5,807 |
|
Increase % |
|
|
44 |
% |
|
|
24 |
% |
|
|
40 |
% |
|
|
|
|
|
|
|
|
|
|
|||
Fee-Earning AUM
Fee-earning AUM reflects the assets from which we earn management fee revenue. The assets we manage that are included in our fee-earning AUM typically pay management fees based on capital commitments, invested capital or, in certain cases, NAV, depending on the fee terms.
Management fees are only marginally affected by market appreciation or depreciation because substantially all of the funds pay management fees based on commitments or invested capital.
Our calculation of fee-earning AUM may differ from the calculations of other investment managers and, as a result, may not be comparable to similar measures presented by other investments managers. The table below presents rollforwards of our total fee-earning AUM for 2021, 2020, and 2019:
|
|
Year Ended December 31, |
|
|||||||||
($ in millions) |
|
2021 |
|
|
2020 |
|
|
2019 |
|
|||
Balance as of beginning of year |
|
$ |
10,214 |
|
|
$ |
8,727 |
|
|
$ |
5,848 |
|
Increases (capital raised/deployment)(1) |
|
|
4,545 |
|
|
|
2,268 |
|
|
|
3,464 |
|
Changes in fair market value |
|
|
(26 |
) |
|
|
12 |
|
|
|
— |
|
Decreases (liquidations/other)(2) |
|
|
(1,370 |
) |
|
|
(793 |
) |
|
|
(585 |
) |
Fee-earning AUM as of end of year |
|
$ |
13,363 |
|
|
$ |
10,214 |
|
|
$ |
8,727 |
|
Increase |
|
|
3,149 |
|
|
|
1,487 |
|
|
|
2,879 |
|
Increase % |
|
|
31 |
% |
|
|
17 |
% |
|
|
49 |
% |
54
The launch of new funds resulted in an increased fee-earning AUM for the years ended December 31, 2021, 2020 and 2019. Fee-earning AUM increased 31%, from approximately $10.2 billion as of December 31, 2020 to $13.4 billion as of December 31, 2021, due to our capital raising activities and deployment. The following table summarizes our balances of fee-earning AUM by fund as of December 31, 2021, 2020 and 2019:
|
|
December 31, |
|
|||||||||
(in millions) |
|
2021 |
|
|
2020 |
|
|
2019 |
|
|||
Fee-Earning AUM by Fund |
|
|
|
|
|
|
|
|
|
|||
Bridge Multifamily Fund III |
|
$ |
269 |
|
|
$ |
401 |
|
|
$ |
527 |
|
Bridge Multifamily III JV Partners |
|
|
4 |
|
|
|
10 |
|
|
|
13 |
|
Bridge Multifamily Fund IV |
|
|
1,284 |
|
|
|
1,574 |
|
|
|
1,579 |
|
Bridge Multifamily Fund V |
|
|
976 |
|
|
|
— |
|
|
|
— |
|
Bridge Workforce Fund I |
|
|
556 |
|
|
|
499 |
|
|
|
608 |
|
Bridge Workforce Fund II |
|
|
915 |
|
|
|
166 |
|
|
|
— |
|
Bridge Opportunity Zone Fund I |
|
|
482 |
|
|
|
482 |
|
|
|
466 |
|
Bridge Opportunity Zone Fund II |
|
|
408 |
|
|
|
408 |
|
|
|
414 |
|
Bridge Opportunity Zone Fund III |
|
|
1,019 |
|
|
|
1,028 |
|
|
|
— |
|
Bridge Opportunity Zone Fund IV |
|
|
1,490 |
|
|
|
— |
|
|
|
— |
|
Bridge Office Fund I |
|
|
499 |
|
|
|
500 |
|
|
|
548 |
|
Bridge Office I JV Partners |
|
|
130 |
|
|
|
154 |
|
|
|
154 |
|
Bridge Office Fund II |
|
|
176 |
|
|
|
89 |
|
|
|
81 |
|
Bridge Office II JV Partners |
|
|
6 |
|
|
|
21 |
|
|
|
7 |
|
Bridge Seniors Housing Fund I |
|
|
626 |
|
|
|
626 |
|
|
|
626 |
|
Bridge Seniors Housing Fund II |
|
|
805 |
|
|
|
769 |
|
|
|
937 |
|
Bridge Seniors Housing Fund III |
|
|
33 |
|
|
|
33 |
|
|
|
— |
|
Bridge Debt Strategies Fund I |
|
|
— |
|
|
|
41 |
|
|
|
48 |
|
Bridge Debt Strategies I JV Partners |
|
|
18 |
|
|
|
18 |
|
|
|
18 |
|
Bridge Debt Strategies Fund II |
|
|
354 |
|
|
|
678 |
|
|
|
933 |
|
Bridge Debt Strategies II JV Partners |
|
|
195 |
|
|
|
343 |
|
|
|
408 |
|
Bridge Debt Strategies Fund III |
|
|
1,286 |
|
|
|
1,549 |
|
|
|
1,279 |
|
Bridge Debt Strategies III JV Partners |
|
|
308 |
|
|
|
416 |
|
|
|
81 |
|
Bridge Debt Strategies Fund IV |
|
|
1,133 |
|
|
|
305 |
|
|
|
— |
|
Bridge Debt Strategies Fund IV JV Partners |
|
|
129 |
|
|
|
— |
|
|
|
— |
|
Bridge Net Lease Fund |
|
|
29 |
|
|
|
— |
|
|
|
— |
|
Bridge Logistics U.S. Venture I |
|
|
110 |
|
|
|
— |
|
|
|
— |
|
Bridge Agency MBS Fund |
|
|
123 |
|
|
|
104 |
|
|
|
— |
|
Total Fee-Earning AUM |
|
$ |
13,363 |
|
|
$ |
10,214 |
|
|
$ |
8,727 |
|
Our average remaining fund life for our closed-end funds was approximately 8.0 years as of December 31, 2021 compared to 7.2 years and 7.9 years as of December 31, 2020 and 2019, respectively.
Undeployed Capital
As of December 31, 2021, we had $2.7 billion of undeployed capital available to be deployed for future investment or reinvestment. Of this amount, $2.0 billion is currently fee-earning based on commitments and $0.7 billion will be fee-earning if and when it is deployed.
55
Our Performance
We have a demonstrated record of producing attractive returns for our fund investors across our platforms. Our historical investment returns have been recognized by third parties such as Preqin Ltd., which ranked each of our last three multifamily funds and our first workforce and affordable housing funds in the top quartile for their vintage. Our historical investment returns for our closed-end funds by platform are shown in the chart below.
Performance Summary as of December 31, 2021 |
|
|||||||||||||||||||||||||||||||||||
|
|
|
|
|
Unreturned |
|
|
|
|
|
|
|
|
|
|
|
|
|
|
|
|
|
|
|
|
|
|
|
||||||||
|
|
|
|
|
Drawn |
|
|
|
|
|
|
|
|
|
|
|
|
|
Total |
|
|
|
|
Fund |
|
|
|
|
||||||||
|
|
Fund |
|
|
Capital + |
|
|
Cumulative |
|
|
Realized |
|
|
Remaining |
|
|
|
|
Fair |
|
|
TFV |
|
Gross |
|
|
Net |
|
||||||||
|
|
Committed |
|
|
Accrued |
|
|
Invested |
|
|
Proceeds |
|
|
Fair Value |
|
|
Unrealized |
|
Value |
|
|
MOIC |
|
IRR |
|
|
IRR |
|
||||||||
(in millions) |
|
Capital (2) |
|
|
Pref (3) |
|
|
Capital (4) |
|
|
(5) |
|
|
(RFV) (6) |
|
|
MOIC (7) |
|
TFV (8) |
|
|
(9) |
|
(10) |
|
|
(11) |
|
||||||||
Closed-End Funds(1) |
|
|
|
|
|
|
|
|
|
|
|
|
|
|
|
|
|
|
|
|
|
|
|
|
|
|
|
|
||||||||
(Investment Period Beginning, Ending Date) |
|
|
|
|
|
|
|
|
|
|
|
|
|
|
|
|
|
|
|
|
|
|
|
|
|
|
|
|
||||||||
Equity Strategies Funds |
|
|
|
|
|
|
|
|
|
|
|
|
|
|
|
|
|
|
|
|
|
|
|
|
|
|
|
|
||||||||
Multifamily |
|
|
|
|
|
|
|
|
|
|
|
|
|
|
|
|
|
|
|
|
|
|
|
|
|
|
|
|
||||||||
Bridge Multifamily I |
|
$ |
124 |
|
|
$ |
— |
|
|
$ |
150 |
|
|
$ |
280 |
|
|
$ |
— |
|
|
NA |
|
$ |
280 |
|
|
1.87x |
|
|
21.0 |
% |
|
|
15.3 |
% |
Bridge Multifamily II |
|
|
596 |
|
|
|
— |
|
|
|
605 |
|
|
|
1,264 |
|
|
|
— |
|
|
NA |
|
|
1,264 |
|
|
2.09x |
|
|
30.2 |
% |
|
|
23.4 |
% |
Bridge Multifamily III |
|
|
912 |
|
|
|
— |
|
|
|
875 |
|
|
|
1,420 |
|
|
|
690 |
|
|
3.03x |
|
|
2,111 |
|
|
2.41x |
|
|
28.2 |
% |
|
|
21.6 |
% |
Bridge Multifamily IV |
|
|
1,590 |
|
|
|
1,451 |
|
|
|
1,338 |
|
|
|
180 |
|
|
|
2,430 |
|
|
1.95x |
|
|
2,610 |
|
|
1.95x |
|
|
44.7 |
% |
|
|
34.4 |
% |
Total Multifamily Funds |
|
|
3,221 |
|
|
|
1,451 |
|
|
|
2,968 |
|
|
|
3,145 |
|
|
|
3,121 |
|
|
2.13x |
|
|
6,266 |
|
|
2.11x |
|
|
29.6 |
% |
|
|
23.2 |
% |
|
|
|
|
|
|
|
|
|
|
|
|
|
|
|
|
|
|
|
|
|
|
|
|
|
|
|
|
|
||||||||
Bridge Workforce Housing I |
|
|
619 |
|
|
|
636 |
|
|
|
558 |
|
|
|
81 |
|
|
|
1,118 |
|
|
2.15x |
|
|
1,199 |
|
|
2.15x |
|
|
40.1 |
% |
|
|
32.2 |
% |
|
|
|
|
|
|
|
|
|
|
|
|
|
|
|
|
|
|
|
|
|
|
|
|
|
|
|
|
|
||||||||
Bridge Office I |
|
|
573 |
|
|
|
615 |
|
|
|
596 |
|
|
|
167 |
|
|
|
576 |
|
|
1.24x |
|
|
743 |
|
|
1.25x |
|
|
8.6 |
% |
|
|
5.8 |
% |
Bridge Office II |
|
|
208 |
|
|
|
154 |
|
|
|
182 |
|
|
|
19 |
|
|
|
234 |
|
|
1.39x |
|
|
252 |
|
|
1.39x |
|
|
33.3 |
% |
|
|
25.8 |
% |
Total Office Funds |
|
|
781 |
|
|
|
769 |
|
|
|
777 |
|
|
|
185 |
|
|
|
809 |
|
|
1.27x |
|
|
995 |
|
|
1.28x |
|
|
11.1 |
% |
|
|
7.8 |
% |
|
|
|
|
|
|
|
|
|
|
|
|
|
|
|
|
|
|
|
|
|
|
|
|
|
|
|
|
|
||||||||
Seniors Housing |
|
|
|
|
|
|
|
|
|
|
|
|
|
|
|
|
|
|
|
|
|
|
|
|
|
|
|
|
||||||||
Bridge Seniors I |
|
|
578 |
|
|
|
769 |
|
|
|
632 |
|
|
|
303 |
|
|
|
562 |
|
|
1.34x |
|
|
865 |
|
|
1.37x |
|
|
6.9 |
% |
|
|
4.4 |
% |
Bridge Seniors II |
|
|
820 |
|
|
|
824 |
|
|
|
710 |
|
|
|
159 |
|
|
|
774 |
|
|
1.31x |
|
|
933 |
|
|
1.31x |
|
|
10.1 |
% |
|
|
6.8 |
% |
Total Senior Housing Funds |
|
|
1,399 |
|
|
|
1,593 |
|
|
|
1,342 |
|
|
|
462 |
|
|
|
1,336 |
|
|
1.32x |
|
|
1,798 |
|
|
1.34x |
|
|
8.1 |
% |
|
|
5.3 |
% |
|
|
|
|
|
|
|
|
|
|
|
|
|
|
|
|
|
|
|
|
|
|
|
|
|
|
|
|
|
||||||||
Total Equity Strategies Funds |
|
|
6,020 |
|
|
|
4,449 |
|
|
|
5,645 |
|
|
|
3,873 |
|
|
|
6,384 |
|
|
1.74x |
|
|
10,257 |
|
|
1.82x |
|
|
24.0 |
% |
|
|
18.0 |
% |
|
|
|
|
|
|
|
|
|
|
|
|
|
|
|
|
|
|
|
|
|
|
|
|
|
|
|
|
|
||||||||
Debt Strategies Funds |
|
|
|
|
|
|
|
|
|
|
|
|
|
|
|
|
|
|
|
|
|
|
|
|
|
|
|
|
||||||||
Bridge Debt I |
|
|
132 |
|
|
|
— |
|
|
|
219 |
|
|
|
247 |
|
|
|
17 |
|
|
1.22x |
|
|
264 |
|
|
1.20x |
|
|
8.4 |
% |
|
|
6.3 |
% |
Bridge Debt II |
|
|
1,002 |
|
|
|
389 |
|
|
|
2,335 |
|
|
|
2,404 |
|
|
|
395 |
|
|
1.34x |
|
|
2,799 |
|
|
1.20x |
|
|
11.8 |
% |
|
|
9.3 |
% |
Bridge Debt III |
|
|
1,624 |
|
|
|
1,350 |
|
|
|
5,363 |
|
|
|
4,527 |
|
|
|
1,400 |
|
|
1.24x |
|
|
5,927 |
|
|
1.11x |
|
|
14.2 |
% |
|
|
11.1 |
% |
Total Debt Strategies Funds |
|
$ |
2,757 |
|
|
$ |
1,739 |
|
|
$ |
7,917 |
|
|
$ |
7,178 |
|
|
$ |
1,812 |
|
|
1.27x |
|
$ |
8,990 |
|
|
1.14x |
|
|
12.6 |
% |
|
|
9.9 |
% |
|
|
|
|
|
|
|
|
|
|
|
|
|
|
|
|
|
|
|
|
|
|
|
|
|
|
|
|
|
||||||||
Footnotes:
56
The returns presented above are those of the primary funds in each platform and not those of the Company. The returns presented above do not include returns for joint ventures or separately managed accounts. An investment in our Class A common stock is not an investment in any of our funds. The historical returns attributable to our platforms are presented for illustrative purposes only and should not be considered as indicative of the future returns of our Class A common stock or any of our current or future funds. These returns are presented by platform and include multiple funds of varied vintage, including funds that are fully realized, and performance of a specific fund within a platform can vary materially from the return of the platform as a whole. The returns represent aggregate returns for the U.S. domiciled partnerships, and such aggregate returns may differ materially from the fund-level returns for each individual partnership co-investment vehicles or separately managed accounts or each non-U.S. partnership due to varied management fee structures, timing of investments, contributions and distributions and additional structuring costs and taxes.
There is no guarantee that any fund or other vehicle within a platform will achieve its investment objectives or achieve comparable investment returns.
Results of Operations
Year Ended December 31, 2021 Compared to Year Ended December 31, 2020
Revenues
|
|
|
|
|
|
|
|
|
|
|
|||||||
|
|
Year Ended December 31, |
|
|
Amount |
|
|
% |
|
|
|||||||
(in thousands) |
|
2021 |
|
|
2020 |
|
|
Change |
|
|
Change |
|
|
||||
Revenues: |
|
|
|
|
|
|
|
|
|
|
|
|
|
||||
Fund management fees |
|
$ |
155,928 |
|
|
$ |
110,235 |
|
|
$ |
45,693 |
|
|
|
41 |
% |
|
Property management and leasing fees |
|
|
69,654 |
|
|
|
59,986 |
|
|
|
9,668 |
|
|
|
16 |
% |
|
Construction management fees |
|
|
8,292 |
|
|
|
8,155 |
|
|
|
137 |
|
|
|
2 |
% |
|
Development fees |
|
|
3,703 |
|
|
|
1,966 |
|
|
|
1,737 |
|
|
|
88 |
% |
|
Transaction fees |
|
|
75,073 |
|
|
|
39,298 |
|
|
|
35,775 |
|
|
|
91 |
% |
|
Insurance premiums |
|
|
10,051 |
|
|
|
6,291 |
|
|
|
3,760 |
|
|
|
60 |
% |
|
Other asset management and property income |
|
|
7,313 |
|
|
|
6,017 |
|
|
|
1,296 |
|
|
|
22 |
% |
|
Total revenues |
|
$ |
330,014 |
|
|
$ |
231,948 |
|
|
$ |
98,066 |
|
|
|
42 |
% |
|
Fund Management Fees. Fund management fees increased by $45.7 million, or 41%, largely due to the launch of new funds and the timing of deployment of capital. Bridge Debt Strategies Fund IV had its first closing in December 2020 and Bridge Opportunity Zone Fund IV and Bridge Multifamily Fund V had their first closings subsequent to December 31, 2020. These three funds contributed $27.9 million of fund management fees for 2021. Increased fee-earning AUM related to capital raises in our other funds, mainly from Bridge Office Fund II, Bridge Workforce and Affordable Housing Fund II and Bridge Opportunity Zone Fund III, generated an additional $24.2 million. These increases were partially offset by decreases of $6.0 million related to reductions in fee-earning AUM attributed to Bridge Multifamily Fund III and Bridge Debt Strategies Fund II.
Our fee-earning AUM increased $3.1 billion, or 31%, from $10.2 billion as of December 31, 2020 to $13.4 billion as of December 31, 2021. Our weighted-average management fee, which varies largely due to the size of investor commitments, increased from 1.46% as of December 31, 2020 to 1.54% as of December 31, 2021.
57
The chart below presents the composition of our fund management fees for the years ended December 31, 2021, 2020, and 2019:
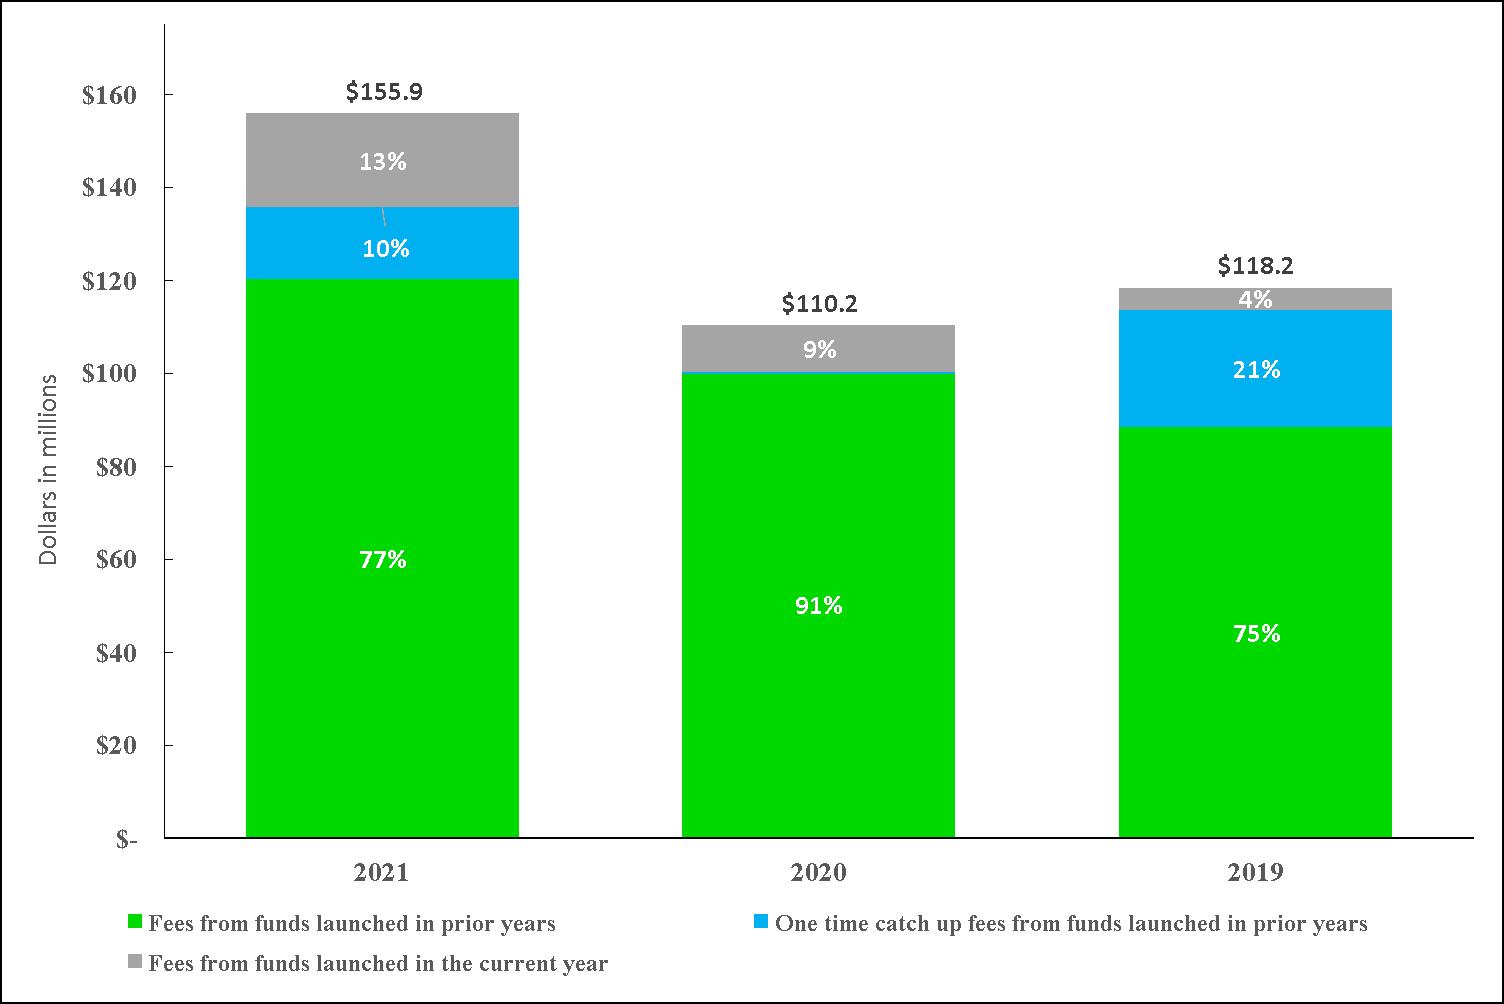
Property Management and Leasing Fees. Property management and leasing fees increased by $9.7 million, or 16%, primarily due to significant leasing activity in the Atlanta region and an increase in the number of properties that we manage, which increased from approximately 48,000 units as of December 31, 2020 to 59,000 units as of December 31, 2021.
Development Fees. Development fees increased by $1.7 million, or 88%, due to an increase in the number of development deals under management, largely due to continued development of projects under Bridge Opportunity Zone Funds I and II, and the launch of Bridge Opportunity Zone Fund III in 2020 and Bridge Opportunity Zone Fund IV in 2021.
Transaction Fees. Transaction fees increased by $35.8 million, or 91%, primarily driven by a $29.6 million increase in due diligence fees attributed to the deployment of $4.5 billion of capital during the year ended December 31, 2021. The remaining $6.2 million increase was related to debt origination fees, which were largely due to an increase in acquisitions and mortgage re-financings related to multifamily assets.
Insurance Premiums. Insurance premiums increased by $3.8 million, or 60%, largely due to the increase in AUM.
Other Asset Management and Property Income. Other asset management and property income increased by $1.3 million, or 22%, due to an increase in tax fees and other income.
Investment Income
|
|
Year Ended December 31, |
|
|
Amount |
|
|
% |
|
|||||||
(in thousands) |
|
2021 |
|
|
2020 |
|
|
Change |
|
|
Change |
|
||||
Investment income: |
|
|
|
|
|
|
|
|
|
|
|
|
||||
Incentive fees |
|
$ |
2,469 |
|
|
$ |
— |
|
|
$ |
2,469 |
|
|
NA |
|
|
Performance allocations: |
|
|
|
|
|
|
|
|
|
|
|
|
||||
Realized gains |
|
|
80,970 |
|
|
|
42,365 |
|
|
|
38,605 |
|
|
|
91 |
% |
Unrealized gains |
|
|
248,647 |
|
|
|
61,803 |
|
|
|
186,844 |
|
|
|
302 |
% |
Earnings from investments in real estate |
|
|
2,132 |
|
|
|
522 |
|
|
|
1,610 |
|
|
|
308 |
% |
Total investment income |
|
$ |
334,218 |
|
|
$ |
104,690 |
|
|
$ |
229,528 |
|
|
|
219 |
% |
58
Incentive Fees. We earned incentive fees of $2.5 million related to the disposition of certain managed investments during year ended December 31, 2021. No such dispositions occurred during the year ended December 31, 2020.
Performance Allocations. Performance allocations increased by $225.4 million, or 216%, largely driven by our carried interest. The following table reflects our performance allocations by fund:
|
|
Year Ended |
|
|
Year Ended |
|
||||||||||
|
|
December 31, 2021 |
|
|
December 31, 2020 |
|
||||||||||
(in thousands) |
|
Realized |
|
|
Unrealized |
|
|
Realized |
|
|
Unrealized |
|
||||
BMF IV GP |
|
$ |
— |
|
|
$ |
139,571 |
|
|
$ |
— |
|
|
$ |
25,974 |
|
BWH I GP |
|
|
— |
|
|
|
58,728 |
|
|
|
— |
|
|
|
15,877 |
|
BDS III GP |
|
|
20,366 |
|
|
|
31,413 |
|
|
|
6,716 |
|
|
|
23,619 |
|
BDS II GP |
|
|
96 |
|
|
|
23,637 |
|
|
|
5,598 |
|
|
|
(18,331 |
) |
BWH II GP |
|
|
— |
|
|
|
6,341 |
|
|
|
— |
|
|
|
— |
|
BDS IV GP |
|
|
— |
|
|
|
3,070 |
|
|
|
— |
|
|
|
— |
|
BOF II GP |
|
|
— |
|
|
|
2,777 |
|
|
|
— |
|
|
|
2,609 |
|
BMF III GP |
|
|
60,508 |
|
|
|
255 |
|
|
|
30,063 |
|
|
|
3,122 |
|
BDS I GP |
|
|
— |
|
|
|
35 |
|
|
|
(12 |
) |
|
|
(5 |
) |
BSH I GP |
|
|
— |
|
|
|
— |
|
|
|
— |
|
|
|
(93 |
) |
BAMBS GP |
|
|
— |
|
|
|
(40 |
) |
|
|
— |
|
|
|
903 |
|
BOF I GP |
|
|
— |
|
|
|
(17,140 |
) |
|
|
— |
|
|
|
8,128 |
|
Total |
|
$ |
80,970 |
|
|
$ |
248,647 |
|
|
$ |
42,365 |
|
|
$ |
61,803 |
|
For the year ended December 31, 2021, the increase in realized performance allocations was driven by dispositions by our multifamily and debt funds and the increase in our unrealized performance allocations was largely due to the market appreciation from properties within our multifamily and workforce and affordable housing real estate equity funds and favorable market conditions in our debt funds. Performance allocations are recorded one quarter in arrears, and as such the performance allocation income reflects asset valuations as of September 30, 2021 and 2020.
Earnings from Investments in Real Estate. Earnings from investments in real estate increased by $1.6 million, largely driven by distributions from the investments in Bridge Multifamily Fund III related to the GP Lenders.
|
|
Year Ended December 31, |
|
|
Amount |
|
|
% |
|
|||||||
(in thousands) |
|
2021 |
|
|
2020 |
|
|
Change |
|
|
Change |
|
||||
Expenses: |
|
|
|
|
|
|
|
|
|
|
|
|
||||
Employee compensation and benefits |
|
$ |
142,707 |
|
|
$ |
100,932 |
|
|
$ |
41,775 |
|
|
|
41 |
% |
Incentive fee compensation |
|
|
215 |
|
|
|
— |
|
|
|
215 |
|
|
NA |
|
|
Performance allocations compensation: |
|
|
|
|
|
|
|
|
|
|
|
|
||||
Realized gains |
|
|
6,611 |
|
|
|
4,281 |
|
|
|
2,330 |
|
|
|
54 |
% |
Unrealized gains |
|
|
31,069 |
|
|
|
8,983 |
|
|
|
22,086 |
|
|
|
246 |
% |
Loss and loss adjustment expenses |
|
|
8,075 |
|
|
|
3,119 |
|
|
|
4,956 |
|
|
|
159 |
% |
Third-party operating expenses |
|
|
33,427 |
|
|
|
28,415 |
|
|
|
5,012 |
|
|
|
18 |
% |
General and administrative expenses |
|
|
24,815 |
|
|
|
17,249 |
|
|
|
7,566 |
|
|
|
44 |
% |
Depreciation and amortization |
|
|
2,830 |
|
|
|
3,214 |
|
|
|
(384 |
) |
|
|
(12 |
%) |
Total expenses |
|
$ |
249,749 |
|
|
$ |
166,193 |
|
|
$ |
83,556 |
|
|
|
50 |
% |
Employee Compensation and Benefits. Employee compensation and benefits increased by $41.8 million, or 41%, largely due to a $26.4 million increase in salaries, benefits and bonuses attributed to increased headcount driven by the increase in AUM and the number of Bridge-sponsored funds. The remaining increase of $15.4 million was attributed to the timing of profits interests awards granted in 2021 and the issuance of Restricted Class A common stock and RSUs that were issued in connection with our IPO in July 2021.
Performance Allocation Compensation. Performance allocation compensation increased by $24.4 million, or 184%, due to an increase of $2.3 million related to realized performance allocation awards and a $22.1 million increase in unrealized performance allocation compensation which is directly correlated to our performance allocations income during the year ended December 31, 2021 compared to the year ended December 31, 2020 and carry awards issued to employees in December 2021.
59
Loss and Loss Adjustment Expenses. Loss and loss adjustment expenses increased by $5.0 million, or 159%, due to increased claims in Dallas related to ice storms as well as a fire at one of our fund’s multifamily properties in the Atlanta region.
Third-party Operating Expenses. Third-party operating expenses increased by $5.0 million, or 18%, due to an increase in the number of properties managed by third parties and additional leasing activity during 2021 compared to 2020, which was negatively impacted by the pandemic.
General and Administrative Expenses. General and administrative expenses increased by $7.6 million, or 44%, primarily due to higher insurance and professional fees related to being a publicly traded company, an increase in overhead due to the acceleration in the deployment of capital as the return to office movement gained momentum, and transactions costs related to the GBC acquisition announced in December 2021.
Other Income (Expense)
|
|
Year Ended December 31, |
|
|
Amount |
|
|
% |
|
|||||||
(in thousands) |
|
2021 |
|
|
2020 |
|
|
Change |
|
|
Change |
|
||||
Other income (expense) |
|
|
|
|
|
|
|
|
|
|
|
|
||||
Investment income |
|
$ |
9,368 |
|
|
$ |
549 |
|
|
$ |
8,819 |
|
|
|
1606 |
% |
Interest income |
|
|
3,265 |
|
|
|
1,527 |
|
|
|
1,738 |
|
|
|
114 |
% |
Other expenses |
|
|
(1,723 |
) |
|
|
— |
|
|
|
(1,723 |
) |
|
NA |
|
|
Interest expense |
|
|
(8,504 |
) |
|
|
(5,058 |
) |
|
|
(3,446 |
) |
|
|
68 |
% |
Total other income (expense) |
|
$ |
2,406 |
|
|
$ |
(2,982 |
) |
|
$ |
5,388 |
|
|
|
181 |
% |
Investment Income. Investment income increased to $9.4 million for the year ended December 31, 2021 compared to $0.5 million for the year ended December 31, 2020, primarily due to the unrealized appreciation in investments in third-party private property technology, or proptech, companies and other investments.
Interest Income. Interest income increased $1.7 million, or 114%, largely due to increased short-term borrowings to the funds for acquisitions, which is correlated with the increase in AUM during 2021.
Other Expenses. During the year ended December 31, 2021, the Company recognized $1.7 million of expense related to changes in our TRA liability due to a change in tax rates and a reduction in estimated cash savings to be realized by the Company. The change in the TRA liability was entirely allocated to Bridge Investment Group Holdings Inc.
Interest Expense. Interest expense increased by $3.4 million, or 68%, due to an increase in indebtedness incurred under the Private Placement Notes.
Net Income Attributable to Non-Controlling Interests in Bridge Investment Group Holdings LLC. Net income attributable to non-controlling interests in Bridge Investment Group Holdings LLC is comprised of non-controlling interests related to the Operating Company’s subsidiaries (General Partners and Fund Managers) and to our profits interests programs. The following table summarizes the allocation of net income to non-controlling interests in the Operating Company:
|
|
Year Ended December 31, |
|
|||||
(in thousands) |
|
2021 |
|
|
2020 |
|
||
Non-controlling interests related to General Partners - realized |
|
$ |
23,056 |
|
|
$ |
— |
|
Non-controlling interests related to General Partners - unrealized |
|
|
96,380 |
|
|
|
— |
|
Non-controlling interests related to Fund Managers |
|
|
5,904 |
|
|
|
8,400 |
|
Non-controlling interests related to 2019 profits interests awards |
|
|
24,886 |
|
|
|
10,614 |
|
Non-controlling interests related to 2020 profits interests awards |
|
|
2,512 |
|
|
|
521 |
|
Non-controlling interests related to 2021 profits interests awards |
|
|
3,184 |
|
|
|
— |
|
Total |
|
$ |
155,922 |
|
|
$ |
19,535 |
|
Net Income Attributable to Non-Controlling Interests in Bridge Investment Group Holdings Inc. Net income attributable to non-controlling interests in Bridge Investment Group Holdings Inc. was $111.5 million during the year ended December 31, 2021.
60
On January 1, 2022, our 2019 profits interests awards were collapsed into 790,424 shares of our Class A common stock and 13,255,888 Class A Units in the Operating Company. We expect that the 2020 profits interests awards will be collapsed into Class A Units in the Operating Company (or shares of our Class A common stock) on or about January 1, 2023, and that remaining profits interests (relating to 2021 issuances) will be collapsed into Class A Units in the Operating Company (or shares of our Class A common stock) on or about June 30, 2023. The profits interests will be collapsed based on their then-current fair values and the relative value of the Company, based on Distributable Earnings (as defined subsequently) attributable to the Operating Company, Distributable Earnings of the applicable subsidiary where such profits interests are currently held, and the market price of our Class A common stock, in each case as of the date of the collapse. This will result in a decrease in net income attributable to non-controlling interests for the applicable periods; however, there will also be a corresponding increase in the number of outstanding Class A Units at the Operating Company (and shares of our Class B common stock) or shares of our Class A common stock.
Year Ended December 31, 2020 Compared to Year Ended December 31, 2019
Revenues
|
|
Year Ended December 31, |
|
|
Amount |
|
|
% |
|
|||||||
(in thousands) |
|
2020 |
|
|
2019 |
|
|
Change |
|
|
Change |
|
||||
Revenues: |
|
|
|
|
|
|
|
|
|
|
|
|
||||
Fund management fees |
|
$ |
110,235 |
|
|
$ |
118,194 |
|
|
$ |
(7,959 |
) |
|
|
(7 |
%) |
Property management and leasing fees |
|
|
59,986 |
|
|
|
59,754 |
|
|
|
232 |
|
|
|
0 |
% |
Construction management fees |
|
|
8,155 |
|
|
|
7,312 |
|
|
|
843 |
|
|
|
12 |
% |
Development fees |
|
|
1,966 |
|
|
|
555 |
|
|
|
1,411 |
|
|
|
254 |
% |
Transaction fees |
|
|
39,298 |
|
|
|
48,088 |
|
|
|
(8,790 |
) |
|
|
(18 |
%) |
Insurance premiums |
|
|
6,291 |
|
|
|
5,246 |
|
|
|
1,045 |
|
|
|
20 |
% |
Other asset management and property income |
|
|
6,017 |
|
|
|
7,127 |
|
|
|
(1,110 |
) |
|
|
(16 |
%) |
Total revenues |
|
$ |
231,948 |
|
|
$ |
246,276 |
|
|
$ |
(14,328 |
) |
|
|
(6 |
%) |
Fund Management Fees. Fund management fees decreased by $8.0 million, or 7%, largely due to the different phases in their life cycles that certain of our funds were in during each year. We had final investor closings for Bridge Multifamily Fund IV, Bridge Debt Strategies Fund III, Bridge Workforce Fund I, and Bridge Office Fund I during 2019, of which Bridge Multifamily Fund IV and Bridge Debt Strategies Fund III were our two largest funds to-date. As a result, we earned catch up revenue of approximately $25.1 million during 2019 dating back to the inception of each of those funds. Additionally, during 2020, we launched Bridge Debt Strategies Fund IV, Bridge Workforce Fund II, Bridge Seniors Housing Fund III, Bridge Opportunity Zone Fund III and Bridge Agency MBS Fund, which contributed $10.1 million of management fees. Our fee-earning AUM increased from $8.7 billion as of December 31, 2019 to $10.2 billion as of December 31, 2020.
Our weighted-average management fee decreased from 1.49% as of the year ended December 31, 2019 to 1.46% as of the year ended December 31, 2020. Our weighted-average management fee varies largely due to the size of investor commitments. Our funds generally offer lower management fee percentages for commitments over certain thresholds, which is the driver in the change in the weighted-average management fee. In addition, we launched our first open ended fund in our Agency MBS platform in 2020, which charges management fees at a lower rate and is based on each investor’s quarterly NAV.
Property Management and Leasing Fees. Property management and leasing fees increased by $0.2 million, due to an increase in the number of internally managed assets, largely driven by the increase in acquisitions during the second half of 2019, which was partially offset by a $2.3 million decrease in leasing fees in office assets due to the onset of the COVID-19 pandemic.
Construction Management Fees. Construction management fees increased by $0.8 million, or 12%, due to the significant deployment in 2019 and 2020. The majority of our assets in our multifamily, office and seniors housing funds are value-add funds. As we manage the construction work for the majority of these assets, the increased deployment resulted in increased construction fees.
Development Fees. Development fees increased by $1.4 million, or 254%, due to an increase in the number of development deals under management, largely due to the launch of Bridge Opportunity Zone Funds I and II during 2019 and Bridge Opportunity Zone Fund III during 2020.
Transaction Fees. Transaction fees decreased by $8.8 million, or 18%. Overall, we saw a $7.7 million decrease in our due diligence fees, and a $1.1 million decrease in debt origination fees.
Insurance Premiums. Insurance premiums increased by $1.0 million, or 20%, due to the increased number of assets owned by the funds that we managed that are insured.
61
Other Asset Management and Property Income. Other asset management and property income decreased by $1.1 million, or 16%, largely due to a decrease in additional fees related to subsequent closings in our funds.
Investment Income
|
|
Year Ended December 31, |
|
|
Amount |
|
|
% |
|
|||||||
(in thousands) |
|
2020 |
|
|
2019 |
|
|
Change |
|
|
Change |
|
||||
Investment income: |
|
|
|
|
|
|
|
|
|
|
|
|
||||
Incentive fees |
|
$ |
— |
|
|
$ |
5,898 |
|
|
$ |
(5,898 |
) |
|
NA |
|
|
Performance allocations: |
|
|
|
|
|
|
|
|
|
|
|
|
||||
Realized gains |
|
|
42,365 |
|
|
|
41,738 |
|
|
|
627 |
|
|
|
2 |
% |
Unrealized gains |
|
|
61,803 |
|
|
|
30,051 |
|
|
|
31,752 |
|
|
|
106 |
% |
Earnings from investments in real estate |
|
|
522 |
|
|
|
1,697 |
|
|
|
(1,175 |
) |
|
|
(69 |
%) |
Total investment income |
|
$ |
104,690 |
|
|
$ |
79,384 |
|
|
$ |
25,306 |
|
|
|
32 |
% |
Incentive Fees. We earned incentive fees of $5.9 million related to the disposition of certain managed investments during 2019. No such dispositions occurred during 2020.
Performance Allocations. Performance allocations increased by $32.3 million, or 45%. The following table reflects our realized and unrealized performance allocations by fund:
|
|
Year Ended |
|
|
Year Ended |
|
||||||||||
|
|
December 31, 2020 |
|
|
December 31, 2019 |
|
||||||||||
(in thousands) |
|
Realized |
|
|
Unrealized |
|
|
Realized |
|
|
Unrealized |
|
||||
BMF IV GP |
|
$ |
— |
|
|
$ |
25,974 |
|
|
$ |
— |
|
|
$ |
10,947 |
|
BDS III GP |
|
|
6,716 |
|
|
|
23,619 |
|
|
|
1,651 |
|
|
|
(1,651 |
) |
BWH I GP |
|
|
— |
|
|
|
15,877 |
|
|
|
— |
|
|
|
2,763 |
|
BOF I GP |
|
|
— |
|
|
|
8,128 |
|
|
|
— |
|
|
|
7,216 |
|
BMF III GP |
|
|
30,063 |
|
|
|
3,122 |
|
|
|
26,499 |
|
|
|
13,655 |
|
BOF II GP |
|
|
— |
|
|
|
2,609 |
|
|
|
— |
|
|
|
— |
|
BAMBS GP |
|
|
— |
|
|
|
903 |
|
|
|
— |
|
|
|
— |
|
BDS I GP |
|
|
(12 |
) |
|
|
(5 |
) |
|
|
1,620 |
|
|
|
(4,253 |
) |
BSH I GP |
|
|
— |
|
|
|
(93 |
) |
|
|
— |
|
|
|
(11,613 |
) |
BDS II GP |
|
|
5,598 |
|
|
|
(18,331 |
) |
|
|
11,968 |
|
|
|
12,987 |
|
Total |
|
$ |
42,365 |
|
|
$ |
61,803 |
|
|
$ |
41,738 |
|
|
$ |
30,051 |
|
The increase in unrealized performance allocations was largely due to market appreciation from properties within our multifamily real estate equity funds and increased fee-earning AUM. Performance income allocation is recorded one quarter in arrears, and as such the performance allocation income reflects asset valuations as of September 30, 2020 and 2019.
|
|
Year Ended December 31, |
|
|
Amount |
|
|
% |
|
|||||||
(in thousands) |
|
2020 |
|
|
2019 |
|
|
Change |
|
|
Change |
|
||||
Expenses: |
|
|
|
|
|
|
|
|
|
|
|
|
||||
Employee compensation and benefits |
|
$ |
100,932 |
|
|
$ |
95,156 |
|
|
$ |
5,776 |
|
|
|
6 |
% |
Incentive fee compensation |
|
|
— |
|
|
|
581 |
|
|
|
(581 |
) |
|
NA |
|
|
Performance allocations compensation: |
|
|
|
|
|
|
|
|
|
|
|
|
||||
Realized gains |
|
|
4,281 |
|
|
|
3,895 |
|
|
|
386 |
|
|
|
10 |
% |
Unrealized gains |
|
|
8,983 |
|
|
|
5,461 |
|
|
|
3,522 |
|
|
|
64 |
% |
Loss and loss adjustment expenses |
|
|
3,119 |
|
|
|
2,622 |
|
|
|
497 |
|
|
|
19 |
% |
Third-party operating expenses |
|
|
28,415 |
|
|
|
32,853 |
|
|
|
(4,438 |
) |
|
|
(14 |
%) |
General and administrative expenses |
|
|
17,249 |
|
|
|
17,953 |
|
|
|
(704 |
) |
|
|
(4 |
%) |
Depreciation and amortization |
|
|
3,214 |
|
|
|
2,769 |
|
|
|
445 |
|
|
|
16 |
% |
Total expenses |
|
$ |
166,193 |
|
|
$ |
161,290 |
|
|
$ |
4,903 |
|
|
|
3 |
% |
Employee Compensation and Benefits. Employee compensation and benefits increased by $5.8 million, or 6%, due to increased salaries, bonuses and benefits of $11.6 million from increased headcount, driven by our increase in AUM and the number of Bridge-sponsored funds. This was offset by a $5.9 million decrease in share-based compensation related to our profits interests programs.
62
Performance Allocations Compensation. Performance allocations compensation increased by $3.9 million, or 42%, largely due to the increase in unrealized performance allocation compensation primarily related to our multifamily funds.
Loss and Loss Adjustment Expenses. Loss and loss adjustment expenses increased by $0.5 million, or 19%, due to increased claims.
Third-party Operating Expenses. Third-party operating expenses decreased by $4.4 million, or 14%, due to additional properties being operated by affiliated entities as well as decreased leasing activity related to our office assets.
General and Administrative Expenses. General and administrative expenses decreased by $0.7 million, or 4%, primarily due to lower expense related to reduced travel due to COVID-19 restrictions.
Depreciation and Amortization. Depreciation and amortization increased slightly by $0.4 million, or 16%, due to growth in our fixed assets.
Other Income (Expense)
|
|
Year Ended December 31, |
|
|
Amount |
|
|
% |
|
|||||||
(in thousands) |
|
2020 |
|
|
2019 |
|
|
Change |
|
|
Change |
|
||||
Other (expense) income |
|
|
|
|
|
|
|
|
|
|
|
|
||||
Investment income (loss) |
|
$ |
549 |
|
|
$ |
(1,812 |
) |
|
$ |
2,361 |
|
|
|
130 |
% |
Interest income |
|
|
1,527 |
|
|
|
1,837 |
|
|
|
(310 |
) |
|
|
(17 |
%) |
Interest expense |
|
|
(5,058 |
) |
|
|
(2,777 |
) |
|
|
(2,281 |
) |
|
|
82 |
% |
Total other (expense) income |
|
$ |
(2,982 |
) |
|
$ |
(2,752 |
) |
|
$ |
(230 |
) |
|
|
(8 |
%) |
Investment Income (Loss). Investment income (loss) increased by $2.4 million, or 130%, largely due to a $1.6 million increase in the value of the General Partner Notes Payable and a $1.0 million unrealized gain associated with our investment in Bridge Agency MBS Fund.
Interest Income. Interest income decreased $0.3 million, or 17%, largely due to a decrease in interest rates.
Interest Expense. Interest expense increased by $2.3 million, or 82%, due to interest expense attributable to the issuance of the Private Placement Notes in July 2020.
Net Income Attributable to Non-Controlling Interests in Bridge Investment Group Holdings LLC. Net Income Attributable to Non-Controlling Interests in Bridge Investment Group Holdings LLC is comprised of non-controlling interest related to the Operating Company’s Fund Manager subsidiaries and to our profits interests programs. The following table summarizes the allocation of net income to the non-controlling interest:
|
|
Year Ended December 31, |
|
|||||
(in thousands) |
|
2020 |
|
|
2019 |
|
||
Non-controlling interests related to Fund Managers |
|
$ |
8,400 |
|
|
$ |
12,881 |
|
Non-controlling interests related to 2019 profits interests awards |
|
|
10,614 |
|
|
|
7,390 |
|
Non-controlling interests related to 2020 profits interests awards |
|
|
521 |
|
|
|
— |
|
Total |
|
$ |
19,535 |
|
|
$ |
20,271 |
|
Non-GAAP Financial Measures
We use non-GAAP financial measures, such as Distributable Earnings, Fee Related Earnings, Fee Related Revenues and Fee Related Expenses, to supplement financial information presented in accordance with generally accepted accounting principles in the United States, or GAAP. We believe that excluding certain items from our GAAP results allows management to better understand our consolidated financial performance from period to period and better project our future consolidated financial performance as forecasts are developed at a level of detail different from that used to prepare GAAP-based financial measures. Fee Related Revenues and Fee Related Expenses are presented separately in our calculation of non-GAAP measures in order to better illustrate the profitability of our Fee Related Earnings. Moreover, we believe these non-GAAP financial measures provide our stakeholders with useful information to help them evaluate our operating results by facilitating an enhanced understanding of our operating performance and enabling them to make more meaningful period to period comparisons.
63
There are limitations to the use of the non-GAAP financial measures presented in this report. For example, our non-GAAP financial measures may not be comparable to similarly titled measures of other companies. Other companies, including companies in our industry, may calculate non-GAAP financial measures differently than we do, limiting the usefulness of those measures for comparative purposes.
The non-GAAP financial measures are not meant to be considered as indicators of performance in isolation from or as a substitute for measures prepared in accordance with GAAP, and should be read only in conjunction with financial information presented on a GAAP basis. Reconciliations of each of Distributable Earnings, Fee Related Earnings, Fee Related Revenues and Fee Related Expenses to its most directly comparable GAAP financial measure are presented below. We encourage you to review the reconciliations in conjunction with the presentation of the non-GAAP financial measures for each of the periods presented. In future fiscal periods, we may exclude such items and may incur income and expenses similar to these excluded items.
Distributable Earnings. Distributable Earnings is a key performance measure used in our industry and is evaluated regularly by management in making resource deployment and compensation decisions, and in assessing our performance. We believe that reporting Distributable Earnings is helpful to understanding our business and that investors should review the same supplemental financial measure that management uses to analyze our performance.
Distributable Earnings differs from net income before provision for income taxes, computed in accordance with GAAP in that it does not include depreciation and amortization, unrealized performance allocations and related compensation expense, unrealized gains (losses), share-based compensation, net income attributable to non-controlling interests, charges (credits) related to corporate actions and non-recurring items. Such items, where applicable, include: charges associated with acquisitions or strategic investments, changes in the TRA liability, corporate conversion costs, amortization and any impairment charges associated with acquired intangible assets, transaction costs associated with acquisitions, impairment charges associated with lease right-of-use assets, gains and losses from the retirement of debt, charges associated with contract terminations and employee severance. Distributable Earnings is not a measure of performance calculated in accordance with GAAP. Although we believe the inclusion or exclusion of these items provides investors with a meaningful indication of our core operating performance, the use of Distributable Earnings without consideration of the related GAAP measures is not adequate due to the adjustments described herein. This measure supplements and should be considered in addition to and not in lieu of the results of operations discussed further under “Management’s Discussion and Analysis of Financial Condition and Results of Operations – Results of Operations” prepared in accordance with GAAP. Our calculations of Distributable Earnings may differ from the calculations of other investment managers. As a result, these measures may not be comparable to similar measures presented by other investment managers.
Fee Related Earnings. Fee Related Earnings is a supplemental performance measure used to assess our ability to generate profits from fee-based revenues that are measured and received on a recurring basis. Fee Related Earnings differs from net income before provision for income taxes, computed in accordance with GAAP in that it adjusts for the items included in the calculation of Distributable Earnings, and also adjusts Distributable Earnings to exclude realized performance allocations income and related compensation expense, net insurance income, earnings from investments in real estate, net interest (interest income less interest expense), net realized gain/(loss), and, if applicable, certain general and net administrative expenses when the timing of any future payment is uncertain. Fee Related Earnings is not a measure of performance calculated in accordance with GAAP. The use of Fee Related Earnings without consideration of the related GAAP measures is not adequate due to the adjustments described herein. Our calculations of Fee Related Earnings may differ from the calculations of other investment managers. As a result, these measures may not be comparable to similar measures presented by other investment managers.
Fee Related Revenues. Fee Related Revenues is a component of Fee Related Earnings. Fee Related Revenues is comprised of fund management fees, transaction fees net of any third-party operating expenses, net earnings from Bridge property operators, development fees, and other asset management and property income. Net earnings from Bridge property operators is calculated as a summation of property management, leasing fees and construction management fees less third-party operating expenses and property operating expenses. Property operating expenses is calculated as a summation of employee compensation and benefits, general and administrative expenses and interest expense at our property operators. We believe our vertical integration enhances returns to our shareholders and fund investors, and we view the net earnings from Bridge property operators as part of our fee related revenue as these services are provided to essentially all of the real estate properties in our equity funds. Net earnings from Bridge property operators is a metric that is included in management’s review of our business. Please refer to the reconciliation below to the comparable line items on the consolidated and combined statements of operations. Fee Related Revenues differs from revenue computed in accordance with U.S. GAAP in that it excludes insurance premiums. Additionally, Fee Related Revenues is reduced by the costs associated with our property operations, which are managed internally in order to enhance returns to the Limited Partners in our funds.
64
Fee Related Expenses. Fee Related Expenses is a component of Fee Related Earnings. Fee Related Expenses differs from expenses computed in accordance with GAAP in that it does not include incentive fee compensation, performance allocations compensation, share-based compensation, loss and loss adjustment expenses associated with our insurance business, depreciation and amortization, or charges (credits) related to corporate actions and non-recurring items, and expenses attributable to non-controlling interests in consolidated entities. Additionally, Fee Related Expenses is reduced by the costs associated with our property operations, which are managed internally in order to enhance returns to the Limited Partners in our funds. Fee Related Expenses are used in management’s review of the business. Please refer to the reconciliation below to the comparable line items on the consolidated and combined statements of operations.
Fee Related Revenues and Fee Related Expenses are presented separately in our calculation of non-GAAP measures in order to better illustrate the profitability of our Fee Related Earnings.
Income before provision for income taxes is the GAAP financial measure most comparable to Distributable Earnings and Fee Related Earnings. The following table sets forth a reconciliation of net income to Distributable Earnings attributable to the Operating Company and to Total Fee Related Earnings attributable to the Operating Company for the year ended December 31, 2021, 2020, and 2019.
|
|
Year Ended December 31, |
|
|||||||||
(in thousands) |
|
2021 |
|
|
2020 |
|
|
2019 |
|
|||
Net income |
|
$ |
408,627 |
|
|
$ |
166,457 |
|
|
$ |
160,633 |
|
Income tax provision |
|
|
8,262 |
|
|
|
1,006 |
|
|
|
985 |
|
Income before provision for income taxes |
|
|
416,889 |
|
|
|
167,463 |
|
|
|
161,618 |
|
Depreciation and amortization |
|
|
2,830 |
|
|
|
3,214 |
|
|
|
2,769 |
|
Less: Unrealized performance allocations |
|
|
(248,647 |
) |
|
|
(61,803 |
) |
|
|
(30,051 |
) |
Plus: Unrealized performance allocations compensation |
|
|
31,069 |
|
|
|
8,983 |
|
|
|
5,461 |
|
Less: Unrealized (gains) losses |
|
|
(9,367 |
) |
|
|
(558 |
) |
|
|
2,293 |
|
Plus: Other expenses |
|
|
1,723 |
|
|
|
— |
|
|
|
— |
|
Plus: Share-based compensation |
|
|
21,508 |
|
|
|
6,158 |
|
|
|
12,025 |
|
Less: Net income attributable to non-controlling interests |
|
|
(36,486 |
) |
|
|
(19,535 |
) |
|
|
(20,271 |
) |
Less: Realized performance allocations to non-controlling interests |
|
|
(23,056 |
) |
|
|
— |
|
|
|
— |
|
Distributable Earnings attributable to the Operating |
|
|
156,463 |
|
|
|
103,922 |
|
|
|
133,844 |
|
Realized performance allocations and incentive fees |
|
|
(83,439 |
) |
|
|
(42,365 |
) |
|
|
(47,635 |
) |
Realized performance allocations and incentive fees |
|
|
6,826 |
|
|
|
4,281 |
|
|
|
4,476 |
|
Realized performance allocations to non-controlling interests |
|
|
23,056 |
|
|
|
— |
|
|
|
— |
|
Net insurance income |
|
|
(1,976 |
) |
|
|
(3,172 |
) |
|
|
(2,624 |
) |
(Earnings) losses from investments in real estate |
|
|
(2,132 |
) |
|
|
(522 |
) |
|
|
(1,697 |
) |
Net interest (income) expense and realized (gain) loss |
|
|
5,165 |
|
|
|
3,413 |
|
|
|
337 |
|
Net income attributable to non-controlling interests in |
|
|
36,486 |
|
|
|
19,535 |
|
|
|
20,271 |
|
Total Fee Related Earnings |
|
|
140,449 |
|
|
|
85,092 |
|
|
|
106,972 |
|
Less: Net income attributable to non-controlling |
|
|
(36,486 |
) |
|
|
(19,535 |
) |
|
|
(20,271 |
) |
Total Fee Related Earnings attributable to the Operating Company |
|
$ |
103,963 |
|
|
$ |
65,557 |
|
|
$ |
86,701 |
|
65
The following table sets forth our total Fee Related Earnings and Distributable Earnings attributable to the Operating Company for the years ended December 31, 2021, 2020, and 2019.
|
|
Year Ended December 31, |
|
|||||||||
($ in thousands) |
|
2021 |
|
|
2020 |
|
|
2019 |
|
|||
Fund-level fee revenues |
|
|
|
|
|
|
|
|
|
|||
Fund management fees |
|
$ |
155,928 |
|
|
$ |
110,235 |
|
|
$ |
118,194 |
|
Transaction fees |
|
|
75,073 |
|
|
|
39,298 |
|
|
|
48,088 |
|
Total net fund-level fee revenues |
|
|
231,001 |
|
|
|
149,533 |
|
|
|
166,282 |
|
Net earnings from Bridge property operators |
|
|
11,519 |
|
|
|
8,362 |
|
|
|
6,833 |
|
Development fees |
|
|
3,703 |
|
|
|
1,966 |
|
|
|
555 |
|
Other asset management and property income |
|
|
7,313 |
|
|
|
6,017 |
|
|
|
7,127 |
|
Fee Related Revenues |
|
|
253,536 |
|
|
|
165,878 |
|
|
|
180,797 |
|
Cash-based employee compensation and benefits |
|
|
(96,114 |
) |
|
|
(70,954 |
) |
|
|
(62,620 |
) |
Net administrative expenses |
|
|
(16,973 |
) |
|
|
(9,832 |
) |
|
|
(11,205 |
) |
Fee Related Expenses |
|
|
(113,087 |
) |
|
|
(80,786 |
) |
|
|
(73,825 |
) |
Total Fee Related Earnings |
|
|
140,449 |
|
|
|
85,092 |
|
|
|
106,972 |
|
Fee Related Earnings margin |
|
|
55 |
% |
|
|
51 |
% |
|
|
59 |
% |
Net income attributable to non-controlling interests in |
|
|
(36,486 |
) |
|
|
(19,535 |
) |
|
|
(20,271 |
) |
Total fee related earnings to the Operating Company |
|
|
103,963 |
|
|
|
65,557 |
|
|
|
86,701 |
|
Realized performance allocations and incentive fees |
|
|
83,439 |
|
|
|
42,365 |
|
|
|
47,635 |
|
Realized performance allocations and incentive fees |
|
|
(6,826 |
) |
|
|
(4,281 |
) |
|
|
(4,476 |
) |
Realized performance allocations to non-controlling interests |
|
|
(23,056 |
) |
|
|
— |
|
|
|
— |
|
Net insurance income |
|
|
1,976 |
|
|
|
3,172 |
|
|
|
2,624 |
|
Earnings from investments in real estate |
|
|
2,132 |
|
|
|
522 |
|
|
|
1,697 |
|
Net interest income (expense) and realized gain (loss) |
|
|
(5,165 |
) |
|
|
(3,413 |
) |
|
|
(337 |
) |
Distributable Earnings attributable to the Operating |
|
$ |
156,463 |
|
|
$ |
103,922 |
|
|
$ |
133,844 |
|
The following table sets forth the components of the employee compensation and benefits, general and administrative expenses, and total other income (expense) line items on our consolidated and combined statement of operations. Other income (expense) is disclosed in our non-GAAP measures based upon the nature of the income. Realized amounts are disclosed separately in order to determine Distributable Earnings. Other income from Bridge property operators is included in net earnings from Bridge property operators.
|
|
Year Ended December 31, |
|
|||||||||
($ in thousands) |
|
2021 |
|
|
2020 |
|
|
2019 |
|
|||
Cash-based employee compensation and benefits |
|
$ |
96,114 |
|
|
$ |
70,954 |
|
|
$ |
62,620 |
|
Compensation expense of Bridge property operators |
|
|
25,085 |
|
|
|
23,820 |
|
|
|
20,511 |
|
Share-based compensation |
|
|
21,508 |
|
|
|
6,158 |
|
|
|
12,025 |
|
Employee compensation and benefits |
|
$ |
142,707 |
|
|
$ |
100,932 |
|
|
$ |
95,156 |
|
|
|
|
|
|
|
|
|
|
|
|||
Administrative expenses, net of Bridge property operators |
|
$ |
16,973 |
|
|
$ |
9,832 |
|
|
$ |
11,205 |
|
Administrative expenses of Bridge property operators |
|
|
7,842 |
|
|
|
7,417 |
|
|
|
6,748 |
|
General and administrative expenses |
|
$ |
24,815 |
|
|
$ |
17,249 |
|
|
$ |
17,953 |
|
|
|
|
|
|
|
|
|
|
|
|||
Unrealized gains (losses) |
|
$ |
9,367 |
|
|
$ |
558 |
|
|
$ |
(2,293 |
) |
Other expenses from Bridge property operators |
|
|
(73 |
) |
|
|
(127 |
) |
|
|
(122 |
) |
Other expenses |
|
|
(1,723 |
) |
|
|
— |
|
|
|
— |
|
Net interest income (expense) and realized gain (loss) |
|
|
(5,165 |
) |
|
|
(3,413 |
) |
|
|
(337 |
) |
Total other income (expense) |
|
$ |
2,406 |
|
|
$ |
(2,982 |
) |
|
$ |
(2,752 |
) |
66
Distributable Earnings and Fee Related Earnings to the Operating Company
Year Ended December 31, 2021 Compared to Year Ended December 31, 2020
Total Fee Related Earnings to the Operating Company increased by $38.4 million, or 59%, for 2021 as compared to 2020, while Distributable Earnings to the Operating Company increased by $52.5 million, or 51%, during the same period due to the following:
Year Ended December 31, 2020 Compared to Year Ended December 31, 2019
Total Fee Related Earnings to the Operating Company decreased by $21.1 million, or 24%, for 2020 as compared to 2019, while Distributable Earnings to the Operating Company decreased by $29.9 million, or 22%, during the same period due to the following:
67
Liquidity and Capital Resources
Our liquidity needs primarily include working capital and debt service requirements. We believe that our current sources of liquidity, which include cash generated by our operating activities, cash and funds available under our credit sources, along with the proceeds from our IPO, will be sufficient to meet our projected operating and debt service requirements for at least the next 12 months. To the extent that our current liquidity is insufficient to fund future activities, we may need to raise additional funds. In the future, we may raise additional capital through the sale of equity securities or through debt financing arrangements. If we raise additional funds by issuing equity securities, the ownership of our existing stockholders will be diluted. The incurrence of additional debt financing would result in debt service obligations, and any future instruments governing such debt could provide for operating and financial covenants that could restrict our operations.
As of December 31, 2021 and 2020, we had $78.4 million and $101.8 million of cash and cash equivalents, respectively, $100.1 million and $74.3 million of current liabilities, respectively, and $196.4 million and $150.2 million of long-term liabilities, respectively. There were no borrowings outstanding under our revolving credit facility. We generate cash primarily from fund, property and construction management fees, development fees, and transaction fees. We have historically managed our liquidity and capital resource needs through (a) cash generated from our operating activities and (b) borrowings under credit agreements and other borrowing arrangements.
Ongoing sources of cash include (a) fund management fees and property management and leasing fees, which are collected monthly or quarterly, (b) transaction fee income, and (c) borrowings under our revolving credit facility. In the future, we will also evaluate opportunities, based on market conditions, to access the capital markets. We use cash flow from operations to pay compensation and related expenses, general and administrative expenses, income taxes, debt service, capital expenditures and to make distributions to our equity holders.
Our cash decreased by $23.5 million from December 31, 2020 to December 31, 2021 due to net cash used in financing and investing activities of $118.4 million and $114.3 million, respectively, partially offset by cash provided by operations of $209.2 million. During the year ended December 31, 2021, cash disbursements included $176.3 million and $73.2 million to members and non-controlling interests, respectively. Also, during the year ended December 31, 2021, we received net proceeds of $295.4 million from the issuance of common stock from our IPO, partially offset by $158.1 million purchase of membership interests in the Operating Company and $70.3 million of net issuances of notes receivables.
The following table presents a summary of our cash flows for the periods presented:
|
|
Year Ended December 31, |
|
|||||||||
|
|
2021 |
|
|
2020 |
|
|
2019 |
|
|||
(in thousands) |
|
|
|
|
|
|
|
|
|
|||
Net cash provided by operating activities |
|
$ |
209,224 |
|
|
$ |
130,096 |
|
|
$ |
153,468 |
|
Net cash (used in) provided by investing activities |
|
|
(114,259 |
) |
|
|
(47,813 |
) |
|
|
306 |
|
Net cash used in financing activities |
|
|
(118,447 |
) |
|
|
(35,039 |
) |
|
|
(129,393 |
) |
Total (decrease) increase in cash, cash equivalents, |
|
$ |
(23,482 |
) |
|
$ |
47,244 |
|
|
$ |
24,381 |
|
Operating Activities
Cash provided by operating activities was primarily driven by our earnings in the respective periods after adjusting for significant non-cash activity, including non-cash performance allocations and incentive fees, the related non-cash performance allocations and incentive fee related compensation, non-cash investment income, share-based compensation, depreciation, amortization and impairments, and the effect of changes in working capital and other activities. Operating cash inflows primarily included the receipt of management fees, property management and leasing fees, and realized performance allocations and incentive fees, while operating cash outflows primarily included payments for operating expenses, including compensation and general and administrative expenses.
For the year ended December 31, 2021 — Cash provided by operating activities was $209.2 million, primarily consisting of net income of $408.6 million offset by adjustments for non-cash items of $199.1 million. Adjustments for non-cash items primarily consisted of $248.6 million unrealized performance allocations and $8.8 million of unrealized earnings on equity investments, which was primarily offset by $21.5 million of share-based compensation and $31.1 million of unrealized accrued performance allocations compensation.
68
For the year ended December 31, 2020 — Cash provided by operating activities was $130.1 million, consisting of net income of $166.5 million, offset by adjustments for non-cash items of $43.9 million, and $7.5 million of cash provided by operating assets and liabilities. Adjustments for non-cash items primarily consisted of $61.8 million of unrealized performance allocations, offset by $9.0 million of unrealized accrued performance allocations compensation and $6.2 million of share-based compensation.
For the year ended December 31, 2019 — Cash provided by operating activities was $153.5 million, consisting of net income of $160.6 million, offset by adjustments for non-cash items of $8.2 million, and $1.1 million of cash provided by operating assets and liabilities. Adjustments for non-cash items primarily consisted of $30.1 million for unrealized performance allocations, partially offset by $12.0 million of share-based compensation.
Investing Activities
Our investing activities primarily consist of lending to affiliate entities and investing activities related to our investments in Bridge Agency MBS Fund and in certain property technology companies.
For the year ended December 31, 2021 — Net cash used in investing activities of $114.3 million primarily consisted of $583.3 million in issuances of notes receivable related to our lending activities to affiliate entities, $30.0 million related to a deposit for the GBC transaction, and $14.1 million related to the purchase of investments, which was partially offset by $513.0 million from collections from notes receivables.
For the year ended December 31, 2020 — Net cash used in investing activities of $47.8 million primarily consisted of $14.5 million for purchases of investments largely related to our investment in Bridge Agency MBS Fund and $35.9 million related to our lending activities to affiliate entities.
For the year ended December 31, 2019 — Net cash provided by investing activities of $0.3 million consisted of purchase of fixed assets and our lending activities to affiliate entities.
Financing Activities
Our financing activities primarily consist of distributions to our members and shareholders as well as borrowings associated with our Private Placement Notes and revolving line of credit, and proceeds from the issuance of equity in connection with our IPO.
For the year ended December 31, 2021 — Net cash used in financing activities of $118.4 million was largely due to $176.3 million of distributions to the Operating Company’s members primarily in connection with our IPO, which included a special distribution of $75.0 million, and distributions to non-controlling interests of $73.2 million. We also paid $6.0 million of dividends on our Class A common stock. We utilized $158.1 million of the proceeds from our IPO for the purchase of membership interests in the Operating Company. These usages of funds were partially offset by net proceeds of $295.4 million from the issuance of our Class A common stock in our IPO.
For the year ended December 31, 2020 — Net cash used in financing activities of $35.0 million was primarily due to distributions to our members and non-controlling-interests of $134.2 million and $20.6 million, respectively, and net repayments on our line of credit of $16.8 million. These uses of cash were partially offset by $150.0 million due to the issuance of the Private Placement Notes.
For the year ended December 31, 2019 — Net cash used in financing activities of $129.4 million was primarily due to distributions to our members and non-controlling-interests of $109.4 million and $11.5 million, respectively.
Capital Resources
Credit Facilities
In July 2020, we entered into a note purchase agreement with various lenders, pursuant to which we issued the Private Placement Notes in two tranches.
The Private Placement Notes were issued in an aggregate principal amount of $150.0 million. Concurrently with the issuance of the Private Placement Notes we entered into a secured revolving line of credit, (“LOC”), with an aggregate borrowing capacity of $75.0 million. Net proceeds from the Private Placement Notes were $147.7 million, net of arrangement fees and other expenses. A portion of the proceeds were used to repay the outstanding balances on a prior credit facility.
69
The Private Placement Notes have two tranches, a five-year 3.9% fixed rate that matures on July 22, 2025 and a seven-year 4.15% fixed rate that matures on July 22, 2027. Borrowings under the LOC accrue interest at LIBOR plus 2.25%. We had no borrowings against the LOC as of December 31, 2021 or 2020. The LOC matures on July 22, 2022.
Under the terms of the Private Placement Notes and the LOC, certain of our assets serve as pledged collateral. In addition, the Private Placement Notes and LOC contain covenants that, among other things, limit our ability to incur indebtedness. The Private Placement Notes and the LOC also contain a financial covenant requiring us to maintain a total leverage ratio of no more than 3.0x, minimum quarterly Earnings Before Income Taxes, Depreciation and Amortization, or EBITDA, of $10.0 million and minimum unencumbered cash of $2.5 million. As of both December 31, 2021 and 2020, we were in compliance with all debt covenants.
Contractual Obligations and Commitments
Our principal contractual obligations and commitments consist of obligations under our Private Placement Notes, capital commitments, and lease obligations. The following table summarizes our contractual obligations as of December 31, 2021. The amount of the obligations presented in the table summarizes our commitments to settle contractual obligations in cash as of the time periods presented.
|
Payments Due by Time Period |
|
||||||||||||||||
|
|
|
|
|
Over one |
|
Over three |
|
|
|
|
|
||||||
|
|
|
|
|
year |
|
years |
|
Over |
|
|
|
||||||
|
|
|
One year |
|
through |
|
through |
|
five |
|
Indeterminable |
|
||||||
|
Total |
|
or less |
|
three years |
|
five years |
|
years |
|
maturity |
|
||||||
(in thousands) |
|
|
|
|
|
|
|
|
|
|
|
|
||||||
Operating lease obligations |
$ |
18,191 |
|
$ |
3,606 |
|
$ |
6,199 |
|
$ |
5,765 |
|
$ |
2,621 |
|
$ |
— |
|
Long-term debt obligations(1) |
|
150,000 |
|
|
— |
|
|
— |
|
|
75,000 |
|
|
75,000 |
|
|
— |
|
Interest on debt obligations(2) |
|
27,695 |
|
|
6,037 |
|
|
12,075 |
|
|
7,852 |
|
|
1,731 |
|
|
— |
|
Standby letters of credits |
|
3,362 |
|
|
3,362 |
|
|
— |
|
|
— |
|
|
— |
|
|
— |
|
Capital commitments(3) |
|
23,321 |
|
|
— |
|
|
— |
|
|
— |
|
|
— |
|
|
23,321 |
|
Total contractual obligations |
$ |
222,569 |
|
$ |
13,005 |
|
$ |
18,274 |
|
$ |
88,617 |
|
$ |
79,352 |
|
$ |
23,321 |
|
(1) Estimated principal payments on our debt obligations reflect amounts that would be paid over the term of the Private Placement Notes assuming the debt is held until final maturity.
(2) Estimated interest payments on our debt obligations reflect amounts that would be paid over the term of the Private Placement Notes based on the contractual interest rates and assuming the debt is held until final maturity.
(3) Capital commitments represent our obligations as a limited partner to fund to certain prop tech investments. These amounts are generally due on demand, and accordingly, have been presented as indeterminable. Capital commitments are expected to be called over a period of several years.
The payments that we may be required to make under the TRA are expected to be substantial. Because the timing of amounts to be paid under the TRA cannot be determined as they are dependent on future taxable income, this contractual commitment has not been presented in the table above.
In addition to the commitments specifically noted previously, we enter into a number of contractual commitments in the ordinary course of business. These include software licensing and maintenance, telecommunications services, facilities maintenance and equipment servicing, supplies purchasing, and other goods and services used in the operation of our business. Some of these contracts are renewable or cancellable at least annually, and in certain cases, to secure favorable pricing concessions, we have committed to contracts that may extend to several years.
Off-Balance Sheet Arrangements
As of December 31, 2021, the Company has guaranteed a $3.0 million standby letter of credit related to the self-insurance program of certain properties owned by the funds. Additionally, as of December 31, 2021, the Company has guaranteed a $362,000 standby letter of credit related to one of its operating leases.
Critical Accounting Policies and Estimates
The preparation of consolidated and combined financial statements in conformity with accounting principles generally accepted in the United States of America requires management to make estimates and assumptions that affect the reported amounts of revenues, expenses, assets, and liabilities and disclosure of contingent assets and liabilities in our financial statements. We regularly assess these estimates; however, actual amounts could differ from those estimates. The impact of changes in estimates is recorded in the period in which they become known.
70
An accounting policy is considered to be critical if the nature of the estimates or assumptions is material due to the levels of subjectivity and judgment necessary to account for highly uncertain matters or the susceptibility of such matters to change, and the effect of the estimates and assumptions on financial condition or operating performance. The accounting policies we believe reflect our more significant estimates, judgments and assumptions that are most critical to understanding and evaluating our reported financial results are: consolidation, revenue recognition, fair value measurements, share-based compensation, performance fee-related compensation and accounting for income taxes.
Consolidation
We consolidate all entities that we control through a majority voting interest or as the primary beneficiary of a variable interest entity (“VIE”). Under the VIE model, we are required to perform an analysis as to whether we have a variable interest in an entity and whether the entity is a VIE. In evaluating whether we hold a variable interest, we review all of our financial relationships to determine whether we are exposed to the risks and rewards created and distributed by an entity. We hold variable interests in certain operating subsidiaries not wholly owned by us and in our funds in which we serve as the general partner or managing member. We also assess whether the fees charged to our funds are customary and commensurate with the level of effort required to provide the services. We consider all economic interests, including indirect interests, to determine if a fee is considered a variable interest. We determined our fee arrangements with our funds are not considered to be variable interests.
If we have a variable interest in an entity, we further assess whether the entity is a VIE and, if so, whether we are the primary beneficiary. The assessment of whether an entity is a VIE requires an evaluation of qualitative factors and, where applicable, quantitative factors. These judgments include: (a) determining whether the entity has sufficient equity at risk, (b) evaluating whether the equity holders, as a group, lack the ability to make decisions that significantly affect the economic performance of the entity and (c) determining whether the entity is structured with disproportionate voting rights in relation to their equity interests.
For entities that are determined to be VIEs, we are required to consolidate those entities where we have concluded that we are the primary beneficiary. The primary beneficiary is defined as the variable interest holder with (a) the power to direct the activities of a VIE that most significantly affect the entity’s economic performance and (b) the obligation to absorb losses of the entity or the right to receive benefits from the entity that could potentially be significant to the VIE. In evaluating whether we are the primary beneficiary, we evaluate our economic interests in the entity held either directly or indirectly by us. At each reporting date, we determine whether any reconsideration events have occurred that require us to revisit the primary beneficiary analysis, and we will consolidate or deconsolidate accordingly.
We provide investment advisory services to the funds, which have third-party investors. Certain funds are VIEs because they have not granted the third-party investors substantive rights to terminate or remove the general partner or participating rights. We do not consolidate these funds because we are not the primary beneficiary of those funds, primarily because our fee arrangements are considered customary and commensurate and thus not deemed to be variable interests, and we do not hold any other interests in those funds that are considered more than insignificant. We consolidate certain of our operating subsidiaries that are VIEs because we are the primary beneficiary.
Revenue Recognition
We recognize revenue in accordance with ASC 606, Revenue from Contracts with Customers. Revenue is recognized in a manner that depicts the transfer of promised goods or services to customers and for an amount that reflects the consideration to which we expect to be entitled in exchange for those goods or services. We are required to identify our contracts with customers, identify the performance obligations in a contract, determine the transaction price, allocate the transaction price to the performance obligations in the contract and recognize revenue when (or as) the entity satisfies a performance obligation. In determining the transaction price, variable consideration is included only to the extent that it is probable that a significant reversal in the amount of cumulative revenue recognized would not occur when the uncertainty associated with the variable consideration is resolved. The guidance requires us to assess whether we are the principal versus agent in the arrangement based on the notion of control, which affects recognition of revenue on a gross or net basis. Essentially all of the revenue and operations of the Company are directly or indirectly supporting affiliated investment funds (including joint ventures and separately managed accounts) and derived from or related to their underlying investments.
Fund Management Fees
We recognize management fee revenues when control of the promised services is transferred to customers, in an amount that reflects the consideration that we expect to receive in exchange for those services. For asset management services and the arrangement of administrative services, we satisfy these performance obligations over time because the customer simultaneously receives and consumes the benefits of the services as they are performed.
71
Management fees are reflected net of certain professional and administrative services and distribution and servicing fees paid to third parties for which we are acting as an agent.
Performance Fees
We earn two types of performance fee income, incentive fees and performance allocations, as described below. The underlying investments in the funds reflect valuations on a three-month lag, or as of September 30, 2021, 2020, and 2019 for December 31, 2021, 2020, and 2019, respectively.
Incentive fees are generally calculated as a percentage of the profits earned in respect of certain accounts for which we are the investment manager, subject to the achievement of minimum return levels or performance benchmarks. Incentive fees are typically subject to reversal until the end of a defined performance period, as these fees are affected by changes in the fair value of the assets under management or advisement over such performance period. Moreover, incentive fees that are received prior to the end of the defined performance period are typically subject to clawback, net of tax. We recognize incentive fee income only when these amounts are realized and no longer subject to significant reversal, which is typically at the end of a defined performance period and/or upon expiration of the associated clawback period.
Performance allocations refer to the allocation of performance fees (typically 15% to 20%) from limited partners in certain funds. We account for our performance allocations under the equity method of accounting. Certain funds will allocate carried interest to us, based on cumulative fund performance to date, irrespective of whether such amounts have been realized. These performance allocations are subject to the achievement of minimum return levels (typically 6% to 8%), in accordance with the terms set forth in each respective fund’s governing documents. We recognize income attributable to performance allocations from a fund based on the amount that would be due to us pursuant to the fund’s governing documents, assuming the fund was liquidated based on the current fair value of its underlying investments as of that date. Accordingly, the amount recognized as performance allocation income reflects our share of the gains and losses of the associated fund’s underlying investments measured at their then-fair values, relative to the fair values as of the end of the prior period. Carried interest is generally realized when an underlying investment is profitably disposed of and the fund’s cumulative returns are in excess of the specific hurdle rates, as defined in the applicable governing documents. Carried interest is generally subject to reversal to the extent that the amount received to date exceeds the amount due to us based on cumulative results. Performance allocation is presented separately as investment income within the consolidated and combined statements of operations, and the accrued but unpaid carried interest as of the reporting date reported in within investments in the consolidated and combined balance sheets.
Fair Value Measurements
U.S. GAAP establishes a hierarchical disclosure framework, which prioritizes and ranks the level of market price observability used in measuring financial instruments at fair value. Market price observability is affected by a number of factors, including the type of financial instrument, the characteristics specific to the financial instrument and the state of the marketplace – including the existence and transparency of transactions between market participants. Financial instruments with readily available quoted prices in active markets generally will have a higher degree of market price observability and a lesser degree of judgment used in measuring fair value.
Financial instruments measured and reported at fair value are classified and disclosed based on the observability of inputs used in the determination of their fair values. Note 2, “Significant Accounting Policies,” to our consolidated and combined financial statements describes the criteria for assigning financial assets and liabilities to Levels 1, 2, and 3.
In certain cases, the inputs used to measure fair value may fall into different levels of the fair value hierarchy. In such cases, the level in the fair value hierarchy within which the fair value measurement in its entirety falls has been determined based on the lowest level input that is significant to the fair value measurement in its entirety. Our assessment of the significance of a particular input to the fair value measurement in its entirety requires judgment and consideration of factors specific to the financial instrument.
Share-Based Compensation
Compensation expense relating to the issuance of share-based awards to employees is measured at fair value on the grant date. Compensation expense is recognized on a straight-line basis over the requisite service period of the awards not contingent on employment, with the amount of compensation expense recognized at the end of a reporting period at least equal to the fair value of the portion of the award that has vested through that date. Compensation expense for awards that do not require future service are recognized immediately.
72
The Company recognizes share-based award forfeitures in the period they occur as a reversal of previously recognized compensation expense.
Performance Fee-Related Compensation
A portion of the performance allocations we earn is awarded to employees and other carry participants in the form of award letters, or the carry awards. Liability-classified carry awards to employees and other participants are accounted for as a component of employee compensation and benefits expense contemporaneously with our recognition of the related realized and unrealized performance allocation revenue. Upon a reversal of performance allocation revenue, the related compensation expense, if any, is also reversed. Liabilities recognized for carried interest amounts due to affiliates are not paid until the related performance allocation revenue is realized. We record incentive fee compensation when it is probable that a liability has been incurred and the amount is reasonably estimable. The incentive fee compensation accrual is based on a number of factors, including the cumulative activity for the period and the distribution of the net proceeds in accordance with the applicable governing agreement.
Income Tax
We are subject to U.S. federal and state income taxes, in addition to local and foreign income taxes, with respect to our allocable share of any taxable income generated by the Operating Company that flow through to its interest holders, including us. We have historically been treated as a partnership for U.S. federal and state income tax purposes. As a result, prior to our IPO, we were not subject to U.S. federal and state income taxes. The provision for income taxes in the historical consolidated statements of operations consists of local and foreign income taxes.
Taxes are accounted for using the asset and liability method of accounting. Under this method, deferred tax assets and liabilities are recognized for the expected future tax consequences of differences between the carrying amounts of assets and liabilities and their respective tax basis, using tax rates in effect for the year in which the differences are expected to reverse. The effect of a change in tax rates on deferred tax assets and liabilities is recognized in income in the period when the change is enacted.
Deferred tax assets are reduced by a valuation allowance when it is more likely than not a portion or all of the deferred tax assets will not be realized. The realization of deferred tax assets is dependent on the amount of our future taxable income. When evaluating the realizability of deferred tax assets, all evidence (both positive and negative) is considered. This evidence includes, but is not limited to, expectations regarding future earnings, future reversals of existing temporary tax differences and tax planning strategies.
U.S. GAAP requires us to recognize tax benefits in an amount that is more likely than not to be sustained by the relevant taxing authority upon examination. We analyze our tax filing positions in all of the U.S. federal, state, local and foreign tax jurisdictions where we are required to file income tax returns, as well as for all open tax years in these jurisdictions. If, based on this analysis, we determine that uncertainties in tax positions exist that do not meet the minimum threshold for recognition of the related tax benefit, a liability is recorded in the consolidated and combined financial statements. We recognize interest and penalties, if any, related to unrecognized tax benefits as general and administrative expenses in the consolidated and combined statements of operations. If recognized, the entire amount of unrecognized tax positions would be recorded as a reduction in the provision for income taxes.
Tax laws are complex and subject to different interpretations by the taxpayer and respective governmental taxing authorities. Significant judgment is required in determining tax expense and in evaluating tax positions, including evaluating uncertainties under U.S. GAAP. We review our tax positions quarterly and adjust our tax balances as new information becomes available.
Recent Accounting Pronouncements
For a discussion of new accounting pronouncements recently adopted and not yet adopted, see the Note 2, “Significant Accounting Policies,” to our consolidated and combined financial statements.
JOBS Act
As an emerging growth company under the Jumpstart Our Business Startups Act of 2012, or the JOBS Act, we can take advantage of an extended transition period for complying with new or revised accounting standards. This allows an emerging growth company to delay the adoption of certain accounting standards until those standards would otherwise apply to private companies. We have elected to avail ourselves of this exemption from new or revised accounting standards and, therefore, will not be subject to the same new or revised accounting standards as other public companies that are not emerging growth companies. We intend to rely on other exemptions provided by the JOBS Act, including without limitation, not being required to comply with the auditor attestation requirements of Section 404(b) of Sarbanes-Oxley. As a result, our financial statements may not be comparable to companies that comply with new or revised accounting pronouncements as of public company effective dates.
73
We will remain an emerging growth company until the earliest of (i) the last day of the fiscal year following the fifth anniversary of the IPO, (ii) the last day of the fiscal year in which we have total annual gross revenue of at least $1.07 billion, (iii) the last day of the fiscal year in which we are deemed to be a “large accelerated filer” as defined in Rule 12b-2 under the Exchange Act, which would occur if the market value of our Class A common stock held by non-affiliates exceeded $700 million as of the last business day of the second fiscal quarter of such year, or (iv) the date on which we have issued more than $1.0 billion in non-convertible debt securities during the prior three-year period.
Item 7A. Quantitative and Qualitative Disclosures About Market Risk
In the normal course of business, we are exposed to a broad range of risks inherent in the financial markets in which we participate, including price risk, interest-rate risk, access to and cost of financing risk, liquidity risk, counterparty risk and foreign exchange-rate risk. Potentially negative effects of these risks may be mitigated to a certain extent by those aspects of our investment approach, investment strategies, fundraising practices or other business activities that are designed to benefit, either in relative or absolute terms, from periods of economic weakness, tighter credit markets or financial market dislocations.
Market Risk
Our predominant exposure to market risk is related to our role as general partner or investment manager for our specialized funds and customized separate accounts and the sensitivities to movements in the fair value of their investments, which may adversely affect our equity in income of affiliates. Since our management fees are generally based on commitments or invested capital, our management fee and advisory fee revenue is not significantly impacted by changes in investment values.
Interest Rate Risk
As of December 31, 2021, we had cash of $52.0 million deposited in non-interest-bearing accounts and $26.4 million deposited in interest-bearing accounts, with limited to no interest rate risk. Interest-earning instruments carry a degree of interest rate risk. We do not enter into investments for trading or speculative purposes and have not used any derivative financial instruments to manage our interest rate risk exposure.
Credit and Counterparty Risk
Access to and the cost of obtaining credit from financial institutions and other lenders may be uncertain due to market conditions, and under certain circumstances we may not be able to access financing. We are also a party to agreements providing for various financial services and transactions that contain an element of risk in the event that the counterparties are unable to meet the terms of such agreements. In such agreements, we depend on the respective counterparty to make payment or otherwise perform. We generally endeavor to minimize our risk of exposure by limiting the counterparties with which we enter into financial transactions to reputable financial institutions.
Foreign Exchange Rate Risk
We do not possess significant assets in foreign countries in which we operate or engage in material transactions in currencies other than the U.S. dollar. Therefore, changes in exchange rates are not expected to materially impact our financial statements.
Item 8. Financial Statements and Supplementary Data
Index to Consolidated and Combined Financial Statements |
Page |
Report of Independent Registered Public Accounting Firm (PCAOB ID: |
75 |
Consolidated and Combined Balance Sheets as of December 31, 2021 and 2020 |
76 |
77 |
|
78 |
|
79 |
|
80 |
|
81 |
|
74
Report of Independent Registered Public Accounting Firm
To the shareholders and the Board of Directors of Bridge Investment Group Holdings Inc.
Opinion on the Financial Statements
We have audited the accompanying consolidated and combined balance sheets of Bridge Investment Group Holdings Inc. (the “Company”) as of December 31, 2021 and 2020, the related consolidated and combined statements of operations, comprehensive income, changes in shareholders’/members’ equity, and cash flows, for each of the three years in the period ended December 31, 2021, and the related notes (collectively referred to as the “financial statements”). In our opinion, the financial statements present fairly, in all material respects, the financial position of the Company as of December 31, 2021 and 2020, and the results of its operations and its cash flows for each of the three years in the period ended December 31, 2021, in conformity with accounting principles generally accepted in the United States of America
Basis for Opinion
These financial statements are the responsibility of the Company’s management. Our responsibility is to express an opinion on the Company's financial statements based on our audits. We are a public accounting firm registered with the Public Company Accounting Oversight Board (United States) (PCAOB) and are required to be independent with respect to the Company in accordance with the U.S. federal securities laws and the applicable rules and regulations of the Securities and Exchange Commission and the PCAOB.
We conducted our audits in accordance with the standards of the PCAOB. Those standards require that we plan and perform the audit to obtain reasonable assurance about whether the financial statements are free of material misstatement, whether due to error or fraud. The Company is not required to have, nor were we engaged to perform, an audit of its internal control over financial reporting. As part of our audits, we are required to obtain an understanding of internal control over financial reporting but not for the purpose of expressing an opinion on the effectiveness of the Company’s internal control over financial reporting. Accordingly, we express no such opinion.
Our audits included performing procedures to assess the risks of material misstatement of the financial statements, whether due to error or fraud, and performing procedures that respond to those risks. Such procedures included examining, on a test basis, evidence regarding the amounts and disclosures in the financial statements. Our audits also included evaluating the accounting principles used and significant estimates made by management, as well as evaluating the overall presentation of the financial statements. We believe that our audits provide a reasonable basis for our opinion.
/s/
March 18, 2022
We have served as the Company’s auditor since 2021.
75
BRIDGE INVESTMENT GROUP HOLDINGS INC.
Consolidated and Combined Balance Sheets
(in thousands, except shares and per share amounts)
|
|
December 31, |
|
|||||
|
|
2021 |
|
|
2020 |
|
||
Assets |
|
|
|
|
|
|
||
Current assets: |
|
|
|
|
|
|
||
Cash and cash equivalents |
|
$ |
|
|
$ |
|
||
Restricted cash |
|
|
|
|
|
|
||
Marketable securities, at fair value |
|
|
|
|
|
|
||
Receivables from affiliates |
|
|
|
|
|
|
||
Notes receivable from affiliates |
|
|
|
|
|
|
||
Notes receivable from employees |
|
|
|
|
|
|
||
Prepaid and other current assets |
|
|
|
|
|
|
||
Total current assets |
|
|
|
|
|
|
||
Accrued performance allocations |
|
|
|
|
|
|
||
Other investments |
|
|
|
|
|
|
||
Long-term notes receivable from employees |
|
|
|
|
|
|
||
Tenant improvements, furniture and equipment, net |
|
|
|
|
|
|
||
Intangible assets, net |
|
|
|
|
|
|
||
Goodwill |
|
|
|
|
|
|
||
Deferred tax assets, net |
|
|
|
|
|
|
||
Other assets |
|
|
|
|
|
|
||
Total assets |
|
$ |
|
|
$ |
|
||
|
|
|
|
|
|
|
||
Liabilities and shareholdersʼ/membersʼ equity |
|
|
|
|
|
|
||
Current liabilities: |
|
|
|
|
|
|
||
Accrued performance allocations compensation |
|
$ |
|
|
$ |
|
||
Accounts payable and accrued expenses |
|
|
|
|
|
|
||
Accrued payroll and benefits |
|
|
|
|
|
|
||
General Partner Notes Payable, at fair value |
|
|
|
|
|
|
||
Insurance loss reserves |
|
|
|
|
|
|
||
Self-insurance reserves and unearned premiums |
|
|
|
|
|
|
||
Other current liabilities |
|
|
|
|
|
|
||
Total current liabilities |
|
|
|
|
|
|
||
|
|
|
|
|
|
|
||
Notes payable, net |
|
|
|
|
|
|
||
Other long-term liabilities |
|
|
|
|
|
|
||
Due to affiliates |
|
|
|
|
|
|
||
Total liabilities |
|
|
|
|
|
|
||
|
|
|
|
|
|
|
||
(Note 19) |
|
|
|
|
|
|
||
Shareholdersʼ/membersʼ equity: |
|
|
|
|
|
|
||
Net investment in common control group |
|
|
|
|
|
|
||
Preferred stock, $ |
|
|
|
|
|
|
||
Class A common stock, $ |
|
|
|
|
|
|
||
Class B common stock, $ |
|
|
|
|
|
|
||
Additional paid-in capital |
|
|
|
|
|
|
||
Retained earnings |
|
|
|
|
|
|
||
Accumulated other comprehensive income (loss) |
|
|
( |
) |
|
|
|
|
Bridge Investment Group Holdings Inc. equity |
|
|
|
|
|
|
||
Non-controlling interests in Bridge Investment Group |
|
|
|
|
|
|
||
Non-controlling interests in Bridge Investment Group Holdings Inc. |
|
|
|
|
|
|
||
Total shareholdersʼ/membersʼ equity |
|
|
|
|
|
|
||
Total liabilities and shareholdersʼ/membersʼ equity |
|
$ |
|
|
$ |
|
||
See notes to consolidated and combined financial statements.
76
BRIDGE INVESTMENT GROUP HOLDINGS INC.
Consolidated and Combined Statements of Operations
(in thousands, except shares and per share amounts)
|
|
Year Ended December 31, |
|
|||||||||
|
|
2021 |
|
|
2020 |
|
|
2019 |
|
|||
Revenues: |
|
|
|
|
|
|
|
|||||
Fund management fees |
|
$ |
|
|
$ |
|
|
$ |
|
|||
Property management and leasing fees |
|
|
|
|
|
|
|
|
|
|||
Construction management fees |
|
|
|
|
|
|
|
|
|
|||
Development fees |
|
|
|
|
|
|
|
|
|
|||
Transaction fees |
|
|
|
|
|
|
|
|
|
|||
Insurance premiums |
|
|
|
|
|
|
|
|
|
|||
Other asset management and property income |
|
|
|
|
|
|
|
|
|
|||
Total revenues |
|
|
|
|
|
|
|
|
|
|||
|
|
|
|
|
|
|
|
|
|
|||
Investment income: |
|
|
|
|
|
|
|
|
|
|||
Incentive fees |
|
|
|
|
|
|
|
|
|
|||
Performance allocations: |
|
|
|
|
|
|
|
|
|
|||
Realized gains |
|
|
|
|
|
|
|
|
|
|||
Unrealized gains |
|
|
|
|
|
|
|
|
|
|||
Earnings from investments in real estate |
|
|
|
|
|
|
|
|
|
|||
Total investment income |
|
|
|
|
|
|
|
|
|
|||
|
|
|
|
|
|
|
|
|
|
|||
Expenses: |
|
|
|
|
|
|
|
|
|
|||
Employee compensation and benefits |
|
|
|
|
|
|
|
|
|
|||
Incentive fee compensation |
|
|
|
|
|
|
|
|
|
|||
Performance allocations compensation: |
|
|
|
|
|
|
|
|
|
|||
Realized gains |
|
|
|
|
|
|
|
|
|
|||
Unrealized gains |
|
|
|
|
|
|
|
|
|
|||
Loss and loss adjustment expenses |
|
|
|
|
|
|
|
|
|
|||
Third-party operating expenses |
|
|
|
|
|
|
|
|
|
|||
General and administrative expenses |
|
|
|
|
|
|
|
|
|
|||
Depreciation and amortization |
|
|
|
|
|
|
|
|
|
|||
Total expenses |
|
|
|
|
|
|
|
|
|
|||
|
|
|
|
|
|
|
|
|
|
|||
Other income (expense): |
|
|
|
|
|
|
|
|
|
|||
Investment income (loss) |
|
|
|
|
|
|
|
|
( |
) |
||
Interest income |
|
|
|
|
|
|
|
|
|
|||
Other expenses |
|
|
( |
) |
|
|
|
|
|
|
||
Interest expense |
|
|
( |
) |
|
|
( |
) |
|
|
( |
) |
Total other income (expense) |
|
|
|
|
|
( |
) |
|
|
( |
) |
|
Income before provision for income taxes |
|
|
|
|
|
|
|
|
|
|||
Income tax provision |
|
|
( |
) |
|
|
( |
) |
|
|
( |
) |
Net income |
|
|
|
|
|
|
|
|
|
|||
Net income attributable to non-controlling interests in Bridge |
|
|
|
|
|
|
|
|
|
|||
Net income attributable to Bridge Investment Group Holdings LLC |
|
|
|
|
|
|
|
|
|
|||
Net income attributable to Common Control Group prior to Transactions and IPO |
|
|
|
|
|
|
|
|
|
|||
Net income attributable to non-controlling interests in Bridge Investment |
|
|
|
|
|
|
|
|
|
|||
Net income attributable to Bridge Investment Group Holdings Inc. |
|
$ |
|
|
$ |
|
|
$ |
|
|||
|
|
|
|
|
|
|
|
|
|
|||
Earnings per share of Class A common stock - Basic and Diluted(1) |
|
$ |
|
|
|
|
|
|
|
|||
Weighted-average shares of Class A common stock outstanding - Basic and Diluted(1) |
|
|
|
|
|
|
|
|
|
|||
See notes to consolidated and combined and financial statements.
77
BRIDGE INVESTMENT GROUP HOLDINGS INC.
Consolidated and Combined Statements of Comprehensive Income
(in thousands)
|
|
Year Ended December 31, |
|
|||||||||
|
|
2021 |
|
|
2020 |
|
|
2019 |
|
|||
Net income |
|
$ |
|
|
$ |
|
|
$ |
|
|||
Other comprehensive (loss) income - foreign currency |
|
|
( |
) |
|
|
|
|
|
|
||
Total comprehensive income |
|
|
|
|
|
|
|
|
|
|||
Less: comprehensive income attributable to non-controlling |
|
|
|
|
|
|
|
|
|
|||
Comprehensive income attributable to Bridge Investment |
|
|
|
|
|
|
|
|
|
|||
Less: comprehensive income attributable to Common Control |
|
|
|
|
|
|
|
|
|
|||
Less: comprehensive income attributable to non-controlling |
|
|
|
|
|
|
|
|
|
|||
Comprehensive income attributable to Bridge Investment |
|
$ |
|
|
$ |
|
|
$ |
|
|||
See notes to consolidated and combined financial statements.
78
BRIDGE INVESTMENT GROUP HOLDINGS INC.
Consolidated and Combined Statements of Changes in Shareholders’/Members’ Equity
(in thousands, except per share amounts)
|
|
|
|
|
|
|
|
|
|
|
|
|
|
|
|
|
|
|
|
|
|
|
NCI in |
|
|
|
|
|||||||||
|
|
|
|
|
|
|
|
|
|
|
|
|
|
|
|
|
Accumulated |
|
|
|
|
|
Bridge |
|
|
|
|
|||||||||
|
|
|
|
|
|
|
|
|
|
|
|
|
|
|
other |
|
|
NCI in |
|
|
Investment |
|
|
Total |
|
|||||||||||
|
|
Net |
|
|
|
|
|
|
|
|
Additional |
|
|
|
|
comprehensive |
|
|
Operating |
|
|
Group |
|
|
Shareholdersʼ/ |
|
||||||||||
|
|
investment |
|
|
Class A |
|
|
Class B |
|
|
paid-in |
|
|
Retained |
|
|
income |
|
|
Company |
|
|
Holdings |
|
|
membersʼ |
|
|||||||||
|
|
CCG(1) |
|
|
common stock |
|
|
common stock |
|
|
capital |
|
|
earnings |
|
|
(loss) |
|
|
or CCG(2) |
|
|
Inc.(3) |
|
|
equity |
|
|||||||||
Balance as of December 31, 2018 |
|
$ |
|
|
$ |
— |
|
|
$ |
— |
|
|
$ |
— |
|
|
$ |
— |
|
|
$ |
|
|
$ |
|
|
$ |
— |
|
|
$ |
|
||||
Adoption of new accounting standards (see Note 2) |
|
|
|
|
|
— |
|
|
|
— |
|
|
|
— |
|
|
|
— |
|
|
|
( |
) |
|
|
|
|
|
— |
|
|
|
|
|||
Net income |
|
|
|
|
|
— |
|
|
|
— |
|
|
|
— |
|
|
|
— |
|
|
|
— |
|
|
|
|
|
|
— |
|
|
|
|
|||
Capital contributions |
|
|
— |
|
|
|
— |
|
|
|
— |
|
|
|
— |
|
|
|
— |
|
|
|
— |
|
|
|
|
|
|
— |
|
|
|
|
||
Share-based compensation |
|
|
|
|
|
— |
|
|
|
— |
|
|
|
— |
|
|
|
— |
|
|
|
— |
|
|
|
|
|
|
— |
|
|
|
|
|||
Repurchase of membership interests |
|
|
( |
) |
|
|
— |
|
|
|
— |
|
|
|
— |
|
|
|
— |
|
|
|
— |
|
|
|
— |
|
|
|
— |
|
|
|
( |
) |
Distributions to members |
|
|
( |
) |
|
|
— |
|
|
|
— |
|
|
|
— |
|
|
|
— |
|
|
|
— |
|
|
|
( |
) |
|
|
— |
|
|
|
( |
) |
Balance as of December 31, 2019 |
|
|
|
|
|
— |
|
|
|
— |
|
|
|
— |
|
|
|
— |
|
|
|
— |
|
|
|
|
|
|
— |
|
|
|
|
|||
Net income |
|
|
|
|
|
— |
|
|
|
— |
|
|
|
— |
|
|
|
— |
|
|
|
— |
|
|
|
|
|
|
— |
|
|
|
|
|||
Foreign currency translation adjustment |
|
|
— |
|
|
|
— |
|
|
|
— |
|
|
|
— |
|
|
|
— |
|
|
|
|
|
|
— |
|
|
|
— |
|
|
|
|
||
Capital contributions |
|
|
— |
|
|
|
— |
|
|
|
— |
|
|
|
— |
|
|
|
— |
|
|
|
— |
|
|
|
|
|
|
— |
|
|
|
|
||
Share-based compensation |
|
|
|
|
|
— |
|
|
|
— |
|
|
|
— |
|
|
|
— |
|
|
|
— |
|
|
|
|
|
|
— |
|
|
|
|
|||
Repurchase of membership interests |
|
|
( |
) |
|
|
— |
|
|
|
— |
|
|
|
— |
|
|
|
— |
|
|
|
— |
|
|
|
( |
) |
|
|
— |
|
|
|
( |
) |
Distributions to members |
|
|
( |
) |
|
|
— |
|
|
|
— |
|
|
|
— |
|
|
|
— |
|
|
|
— |
|
|
|
( |
) |
|
|
— |
|
|
|
( |
) |
Balance as of December 31, 2020 |
|
|
|
|
|
— |
|
|
|
— |
|
|
|
— |
|
|
|
— |
|
|
|
|
|
|
|
|
|
— |
|
|
|
|
||||
Net income prior to Transactions and IPO |
|
|
|
|
|
— |
|
|
|
— |
|
|
|
— |
|
|
|
— |
|
|
|
— |
|
|
|
|
|
|
— |
|
|
|
|
|||
Foreign currency translation adjustment prior to Transactions and IPO |
|
|
— |
|
|
|
— |
|
|
|
— |
|
|
|
— |
|
|
|
— |
|
|
|
( |
) |
|
|
— |
|
|
|
— |
|
|
|
( |
) |
Share-based compensation prior to Transactions and IPO |
|
|
|
|
|
— |
|
|
|
— |
|
|
|
— |
|
|
|
— |
|
|
|
— |
|
|
|
|
|
|
— |
|
|
|
|
|||
Capital contributions prior to Transactions and IPO |
|
|
|
|
|
— |
|
|
|
— |
|
|
|
— |
|
|
|
— |
|
|
|
— |
|
|
|
|
|
|
— |
|
|
|
|
|||
Distributions prior to Transactions and IPO |
|
|
( |
) |
|
|
— |
|
|
|
— |
|
|
|
— |
|
|
|
— |
|
|
|
— |
|
|
|
( |
) |
|
|
— |
|
|
|
( |
) |
Repurchase of membership interests prior to Transactions and IPO |
|
|
( |
) |
|
|
— |
|
|
|
— |
|
|
|
— |
|
|
|
— |
|
|
|
— |
|
|
|
( |
) |
|
|
— |
|
|
|
( |
) |
Settlement of accrued performance allocations compensation liability with equity |
|
|
|
|
|
— |
|
|
|
— |
|
|
|
— |
|
|
|
— |
|
|
|
— |
|
|
|
— |
|
|
|
— |
|
|
|
|
||
Recognition of non-controlling interests in certain subsidiaries concurrent |
|
|
( |
) |
|
|
— |
|
|
|
— |
|
|
|
— |
|
|
|
— |
|
|
|
— |
|
|
|
|
|
|
— |
|
|
|
— |
|
|
Derecognition of Bridge Debt Strategies Fund GP LLC |
|
|
|
|
|
— |
|
|
|
— |
|
|
|
— |
|
|
|
— |
|
|
|
— |
|
|
|
— |
|
|
|
— |
|
|
|
|
||
Effects of Transactions and purchase of Operating Company Class A Units |
|
|
( |
) |
|
|
|
|
|
|
|
|
|
|
|
— |
|
|
|
— |
|
|
|
— |
|
|
|
— |
|
|
|
— |
|
|||
Issuance of Class A common stock sold in IPO, net of underwriting discount |
|
|
— |
|
|
|
|
|
|
— |
|
|
|
|
|
|
— |
|
|
|
— |
|
|
|
— |
|
|
|
( |
) |
|
|
|
|||
Purchase of membership interests in the Operating Company |
|
|
— |
|
|
|
— |
|
|
|
( |
) |
|
|
( |
) |
|
|
— |
|
|
|
— |
|
|
|
— |
|
|
|
|
|
|
— |
|
|
Issuance of Class A common stock from Underwritersʼ exercise of |
|
|
— |
|
|
|
|
|
|
— |
|
|
|
|
|
|
— |
|
|
|
— |
|
|
|
— |
|
|
|
( |
) |
|
|
— |
|
||
Deferred tax effect resulting from purchase of Class A Units, net of |
|
|
— |
|
|
|
— |
|
|
|
— |
|
|
|
|
|
|
— |
|
|
|
— |
|
|
|
— |
|
|
|
— |
|
|
|
|
||
Equity reallocation between controlling and non-controlling interests |
|
|
— |
|
|
|
— |
|
|
|
— |
|
|
|
( |
) |
|
|
— |
|
|
|
— |
|
|
|
— |
|
|
|
|
|
|
— |
|
|
Capital contributions subsequent to Transactions and IPO |
|
|
— |
|
|
|
— |
|
|
|
— |
|
|
|
— |
|
|
|
— |
|
|
|
— |
|
|
|
|
|
|
— |
|
|
|
|
||
Net income subsequent to Transactions and IPO |
|
|
— |
|
|
|
— |
|
|
|
— |
|
|
|
— |
|
|
|
|
|
|
— |
|
|
|
|
|
|
|
|
|
|
||||
Foreign currency translation subsequent to Transactions and IPO |
|
|
— |
|
|
|
— |
|
|
|
— |
|
|
|
— |
|
|
|
— |
|
|
|
( |
) |
|
|
— |
|
|
|
— |
|
|
|
( |
) |
Share-based compensation subsequent to Transactions and IPO |
|
|
— |
|
|
|
|
|
|
— |
|
|
|
|
|
|
— |
|
|
|
— |
|
|
|
|
|
|
|
|
|
|
|||||
Distributions subsequent to Transactions and IPO |
|
|
— |
|
|
|
— |
|
|
|
— |
|
|
|
— |
|
|
|
— |
|
|
|
— |
|
|
|
( |
) |
|
|
( |
) |
|
|
( |
) |
Dividends on Class A common stock, $ |
|
|
— |
|
|
|
— |
|
|
|
— |
|
|
|
— |
|
|
|
( |
) |
|
|
— |
|
|
|
— |
|
|
|
— |
|
|
|
( |
) |
Balance as of December 31, 2021 |
|
$ |
— |
|
|
$ |
|
|
$ |
|
|
$ |
|
|
$ |
|
|
$ |
( |
) |
|
$ |
|
|
$ |
|
|
$ |
|
|||||||
For a description of the Transactions related to our initial public offering (“IPO”) refer to Note 1.
(1)
(2)
(3)
See notes to consolidated and combined financial statements.
79
BRIDGE INVESTMENT GROUP HOLDINGS INC.
Consolidated and Combined Statements of Cash Flows
(in thousands)
|
|
Year Ended December 31, |
|
|||||||||
|
|
2021 |
|
|
2020 |
|
|
2019 |
|
|||
CASH FLOWS FROM OPERATING ACTIVITIES |
|
|
|
|
|
|
|
|
|
|||
Net income |
|
$ |
|
|
$ |
|
|
$ |
|
|||
Adjustments to reconcile net income to net cash provided by operating activities: |
|
|
|
|
|
|
|
|
|
|||
Depreciation and amortization |
|
|
|
|
|
|
|
|
|
|||
Amortization of financing costs and debt discount and premium |
|
|
|
|
|
|
|
|
|
|||
Share-based compensation |
|
|
|
|
|
|
|
|
|
|||
Loss on disposal of furniture and equipment |
|
|
— |
|
|
|
|
|
|
|
||
Equity in income of investments |
|
|
( |
) |
|
|
( |
) |
|
|
( |
) |
Changes in unrealized (gain) loss on General Partner Notes Payable |
|
|
( |
) |
|
|
|
|
|
|
||
Amortization of lease liabilities |
|
|
( |
) |
|
|
( |
) |
|
|
( |
) |
Unrealized performance allocations |
|
|
( |
) |
|
|
( |
) |
|
|
( |
) |
Unrealized accrued performance allocations compensation |
|
|
|
|
|
|
|
|
|
|||
Change in deferred income taxes |
|
|
|
|
|
— |
|
|
|
— |
|
|
Changes in operating assets and liabilities: |
|
|
|
|
|
|
|
|
|
|||
Receivable from affiliates |
|
|
( |
) |
|
|
|
|
|
( |
) |
|
Prepaid and other assets |
|
|
( |
) |
|
|
( |
) |
|
|
|
|
Accounts payable and accrued expenses |
|
|
|
|
|
|
|
|
|
|||
Accrued payroll and benefits |
|
|
|
|
|
( |
) |
|
|
|
||
Other liabilities |
|
|
|
|
|
( |
) |
|
|
|
||
Insurance loss and self-insurance reserves |
|
|
|
|
|
|
|
|
|
|||
Accrued performance allocations compensation |
|
|
|
|
|
|
|
|
|
|||
Due to affiliates |
|
|
|
|
|
|
|
|
|
|||
Net cash provided by operating activities |
|
|
|
|
|
|
|
|
|
|||
CASH FLOWS FROM INVESTING ACTIVITIES |
|
|
|
|
|
|
|
|
|
|||
Purchase of investments |
|
|
( |
) |
|
|
( |
) |
|
|
( |
) |
Distributions from investments |
|
|
|
|
|
|
|
|
|
|||
Issuance of notes receivable |
|
|
( |
) |
|
|
( |
) |
|
|
( |
) |
Proceeds from collections on notes receivable |
|
|
|
|
|
|
|
|
|
|||
Purchase of tenant improvements, furniture and equipment |
|
|
( |
) |
|
|
( |
) |
|
|
( |
) |
Deposits on acquisitions |
|
|
( |
) |
|
|
|
|
|
|
||
Net cash (used in) provided by investing activities |
|
|
( |
) |
|
|
( |
) |
|
|
|
|
CASH FLOWS FROM FINANCING ACTIVITIES |
|
|
|
|
|
|
|
|
|
|||
Capital contributions from non-controlling interests |
|
|
|
|
|
|
|
|
|
|||
Distributions to members |
|
|
( |
) |
|
|
( |
) |
|
|
( |
) |
Distributions to non-controlling interests |
|
|
( |
) |
|
|
( |
) |
|
|
( |
) |
Repurchase of membership interests |
|
|
( |
) |
|
|
( |
) |
|
|
( |
) |
Proceeds from issuance of common stock - IPO, net of underwriting |
|
|
|
|
|
|
|
|
|
|||
Purchase of membership interests in Operating Company |
|
|
( |
) |
|
|
|
|
|
|
||
Proceeds from issuance of common stock - Underwritersʼ exercise of |
|
|
|
|
|
— |
|
|
|
— |
|
|
Payments of deferred financing costs |
|
|
— |
|
|
|
( |
) |
|
|
( |
) |
Borrowings from private notes |
|
|
|
|
|
|
|
|
|
|||
Borrowings from notes payable |
|
|
|
|
|
|
|
|
|
|||
Repayment of notes payable |
|
|
|
|
|
( |
) |
|
|
( |
) |
|
Repayments of General Partner Notes Payable |
|
|
( |
) |
|
|
|
|
|
|
||
Proceeds from line of credit |
|
|
|
|
|
|
|
|
|
|||
Repayments on line of credit |
|
|
( |
) |
|
|
( |
) |
|
|
( |
) |
Dividends paid on Class A common stock |
|
|
( |
) |
|
|
|
|
|
|
||
Net cash used in financing activities |
|
|
( |
) |
|
|
( |
) |
|
|
( |
) |
Net (decrease) increase in cash, cash equivalents, and restricted cash |
|
|
( |
) |
|
|
|
|
|
|
||
Cash, cash equivalents and restricted cash - beginning of year |
|
|
|
|
|
|
|
|
|
|||
Cash, cash equivalents and restricted cash - end of year |
|
$ |
|
|
$ |
|
|
$ |
|
|||
|
|
|
|
|
|
|
|
|
|
|||
Supplemental disclosure of cash flow information: |
|
|
|
|
|
|
|
|
|
|||
Net cash paid for income taxes |
|
$ |
|
|
$ |
|
|
$ |
|
|||
Cash paid for interest |
|
|
|
|
|
|
|
|
|
|||
Settlement of accrued performance allocations compensation liability with equity |
|
|
|
|
|
|
|
|
|
|||
Derecognition of Bridge Debt Strategies Fund GP LLC |
|
|
|
|
|
— |
|
|
|
— |
|
|
|
|
|
|
|
|
|
|
|
|
|||
Cash and cash equivalents |
|
$ |
|
|
$ |
|
|
$ |
|
|||
Restricted cash |
|
|
|
|
|
|
|
|
|
|||
Cash, cash equivalents, and restricted cash |
|
$ |
|
|
$ |
|
|
$ |
|
|||
See notes to consolidated and combined financial statements.
80
BRIDGE INVESTMENT GROUP HOLDINGS INC.
Notes to Consolidated and Combined Financial Statements
December 31, 2021, 2020, and 2019
1.
Bridge Investment Group Holdings Inc. (the “Company”) is a leading, vertically integrated real estate investment manager, diversified across specialized asset classes. Our business operation includes ten specialized and synergistic investment platforms, including Multifamily, Workforce and Affordable Housing, Seniors Housing, Office, Development, Net Lease, Logistics Properties, Debt Strategies, Agency MBS, and Single-Family Rental. We provide investors with a diverse range of real estate investment products managed by our dedicated, specialized and synergistic investment teams. Our broad range of products allow us to capture new market opportunities and serve investors with various investment objectives.
The Company was incorporated as a Delaware corporation on March 18, 2021 for the purpose of facilitating an initial public offering (“IPO”) and other related transactions in order to carry on the business of Bridge Investment Group Holdings LLC (formerly known as Bridge Investment Group LLC), or the Operating Company, and its wholly owned subsidiaries. The Company is the sole managing member of the Operating Company, and its only material asset is its ownership interest in the Operating Company. As the sole managing member of the Operating Company, Bridge Investment Group Holdings Inc. indirectly operates and controls all of the Operating Company’s business and affairs.
The Operating Company is the ultimate controlling entity, through its wholly owned subsidiary Bridge Fund Management Holdings LLC, of the following investment manager entities, which we refer to collectively as the Fund Managers: Bridge Multifamily Fund Manager LLC, Bridge Seniors Housing Fund Manager LLC, Bridge Debt Strategies Fund Manager LLC, Bridge Office Fund Manager LLC, Bridge Development Fund Manager LLC, Bridge Agency MBS Fund Manager LLC, Bridge Net Lease Fund Manager LLC, Bridge Logistics Properties Fund Manager LLC, and Bridge Single-Family Rental Fund Manager LLC. The Fund Managers provide real estate and fund investment advisory services on a discretionary basis to multiple investment funds and other vehicles, including joint venture real estate projects, separately managed accounts and privately offered real estate-related limited partnerships, including any parallel investment vehicles and feeder funds, or, collectively, the funds. The Operating Company is entitled to the management fees of the funds based on its ownership in the Fund Managers.
Each time that we establish a new fund, our direct owners also establish a new general partner for that fund. We refer to these general partners collectively as the Bridge GPs. The Operating Company and the Bridge GPs are under common control by the direct owners of the Operating Company and the Bridge GPs. The Bridge GPs are entitled to any performance fees from the funds.
Reorganization in Connection with IPO
In connection with the IPO, the Company completed a series of organizational transactions (the “Transactions”). The Transactions included:
81
Initial Public Offering
On July 20, 2021, the Company completed its initial public offering of
In connection with the IPO, owners of the Contributed Bridge GPs contributed 24% to 40% of their interests in the respective Contributed Bridge GPs in exchange for LLC Interests in the Operating Company. Prior to the IPO, the Operating Company did not have any direct interest in the Contributed Bridge GPs. These combined financial statements prior to the IPO include
Subsequently, on August 12, 2021, the underwriters exercised their over-allotment option to purchase an additional
The Operating Company and the Bridge GPs, collectively defined as “Bridge” or the “Company,” were under common control by the direct owners of Bridge. The owners had the ability to control the Operating Company and each of Bridge GPs and manage and operate these entities through the Fund Managers, a common board of directors, common ownership, and shared resources and facilities. Bridge represented the predecessor history for the consolidated operations. As a result, the financial statements for the periods prior to the IPO are the combined financial statements of Bridge as the predecessor to the Company for accounting and reporting purposes. We carried forward unchanged the value of the related assets and liabilities recognized in the Contributed Bridge GPs’ financial statements prior to the IPO into our financial statements. We have assessed the Contributed Bridge GPs for consolidation subsequent to the Transactions and IPO and have concluded that the Contributed GPs represent variable interests for which the Operating Company is the primary beneficiary. As a result, the Operating Company consolidates the Contributed Bridge GPs following the Transactions. BDS I GP LLC was not contributed as part of the Transactions and as such, was derecognized upon our IPO.
As part of the Transactions, the Operating Company acquired the non-controlling interest of its consolidated subsidiaries BSHM and BOFM, which was accounted for as an equity transaction with no gain or loss recognized in the combined statement of operations. The carrying amounts of the non-controlling interest in BSHM and BOFM were adjusted to zero.
Following the Transactions and IPO, the Company became a holding company whose principal asset is a controlling financial interest in the Operating Company through its ownership of the Operating Company’s Class A Units and
82
2. SIGNIFICANT ACCOUNTING POLICIES
Reclassifications — Certain prior year amounts have been reclassified to conform with the presentation for the year ended December 31, 2021. These prior year reclassifications included the presentation of investments to provide further detail for accrued performance allocations and the separate presentation of deferred tax assets that were previously included in other assets. These reclassifications did not affect net income or shareholders’ equity.
Voting Interest Entities — Unlike VIEs, voting interest entities have sufficient equity to finance their activities and equity investors exhibit the characteristics of a controlling financial interest through their voting rights. The Company consolidates such entities when it has the power to control these entities through ownership of a majority of the entities’ voting interests or through other arrangements.
Non-controlling Interests — Non-controlling interests represent the share of consolidated entities owned by third parties. Bridge recognizes each non-controlling shareholder’s respective ownership at the estimated fair value of the net assets at the date of formation or acquisition. Non-controlling interests are subsequently adjusted for the non-controlling shareholder’s additional contributions, distributions and their share of the net earnings or losses of each respective consolidated entity. Net income is allocated to non-controlling interests based on the weighted-average ownership interest during the period. The net income that is not attributable to Bridge is reflected in net income attributable to non-controlling interests in the consolidated statements of operations and comprehensive income and shareholders’ equity.
Non-controlling interests include non-controlling interests attributable to Bridge Investment Group Holdings Inc. and non-controlling interests attributable to the Operating Company. Non-controlling interests attributable to the Operating Company represent third-party equity interests in the Operating Company subsidiaries related to general partner and fund manager equity interests as well as profit interests awards. Non-controlling interests attributable to Bridge Investment Group Holdings Inc. include equity interests in the Operating Company owned by third-party investors.
83
Use of Estimates — The preparation of consolidated and combined financial statements in conformity with GAAP requires management to make estimates and assumptions that affect the amounts reported in the financial statements and accompanying notes. Management believes that estimates utilized in the preparation of the consolidated financial statements are prudent and reasonable. Such estimates include those used in the valuation of investments, which directly affect accrued performance allocations and related compensation, the carrying amount of the Company's equity method investments, the measurement of deferred tax balances (including valuation allowances), and the accounting for goodwill, all of which involve a high degree of judgement and complexity and may have a significant impact on net income. Actual results could differ from those estimates and such differences could be material.
Cash and Cash Equivalents — The Company considers all cash on hand, demand deposits with financial institutions and short-term highly liquid investments with original maturities of three months or less to be cash equivalents. Cash and cash equivalents are financial instruments that are exposed to concentrations of credit risk. Cash balances may be invested in money market accounts that are not insured. The Company holds and invests its cash with high-credit quality institutions in amounts that regularly exceed the amount insured by the Federal Deposit Insurance Corporation, FDIC, for a single financial institution. However, the Company has not realized any losses in such cash investments or accounts and believes it is not exposed to any significant credit risk.
Restricted Cash — Restricted cash primarily consists of a collateral trust account for the benefit of the insurance carriers associated with Bridge Investment Group Risk Management, Inc. (“BIGRM”). These funds are held as collateral for the insurance carriers in the event of a claim that would require a high deductible payment from BIGRM.
Fair Value — GAAP establishes a hierarchal disclosure framework that prioritizes the inputs used in measuring financial instruments at fair value into three levels based on their market price observability. Market price observability is affected by a number of factors, including the type of instrument and the characteristics specific to the instrument. Financial instruments with readily available quoted prices from an active market or for which fair value can be measured based on actively quoted prices generally have a higher degree of market price observability and a lesser degree of judgment inherent in measuring fair value.
Financial assets and liabilities measured and reported at fair value are classified as follows:
In some instances, an instrument may fall into more than one level of the fair value hierarchy. In such instances, the instrument’s level within the fair value hierarchy is based on the lowest of the three levels (with Level 3 being the lowest) that is significant to the fair value measurement. The Company’s assessment of the significance of an input requires judgment and considers factors specific to the instrument. The Company accounts for the transfer of assets into or out of each fair value hierarchy level as of the beginning of the reporting period (See Note, 8 “Fair Value Measurements,” for further detail).
84
Fair Value Option — The fair value option provides an option to elect fair value as a measurement alternative for selected financial instruments. (See Note 8, “Fair Value Measurements,” for further detail). The fair value option may be elected only upon the occurrence of certain specified events, including when the Company enters into an eligible firm commitment, at initial recognition of the financial instrument, as well as upon a business combination or consolidation of a subsidiary. The election is irrevocable unless a new election event occurs. The Company elected the fair value option for the General Partner Notes Payable. The carrying value of the General Partner Notes Payable represents the related General Partner lenders’ net asset value, NAV, in the respective fund and the General Partner lenders are entitled to receive distributions and carried interest. The NAV changes over time so marking the General Partner Notes Payable to fair value reflect these changes.
Receivables from Affiliates — Receivables consist principally of amounts due from the funds and other affiliates. These include receivables associated with fund or asset management fees, property management fees and other fees. Additionally, the Company is entitled to reimbursements and/or recovers certain costs paid on behalf of the private funds managed by the Company and related properties operated by the Company, which include: (i) organization and offering costs associated with the formation and offering; (ii) direct and indirect operating costs associated with managing the operations of the properties; and (iii) costs incurred in performing investment due diligence.
The Company facilitates the payments of these fees, which are recorded as receivables-principally from affiliated parties on the consolidated and combined balance sheets, until such amounts are repaid. The Company assesses the collectability of such receivables considering the offering period, historical and forecasted capital raising, and establishes an allowance for any balances considered not collectible.
Prepaid Other Current Assets — Prepaid and other assets consist of deposits to fund business and property acquisitions, prepaid insurance, BIGRM premiums receivable, and other prepaid expenses, primarily related to software contracts, which are usually for multiple months and are amortized on a straight-line basis over the life of the contract. See Note 7, “Prepaid and other current assets,” for additional information.
Accrued Performance Allocations — Performance allocations that are received in advance that remain subject to clawback are recorded as accrued performance allocations in the consolidated and combined balance sheets. The Company’s share of net income or loss may differ from the stated ownership percentage interest in an entity if the governing documents prescribe a substantive non-proportionate earnings allocation formula or a preferred return to certain investors. The Company’s share of earnings (losses) from equity method investments is determined using a balance sheet approach referred to as the hypothetical liquidation at book value (“HLBV”) method. Under the HLBV method, at the end of each reporting period Bridge calculates the accrued performance allocations that would be due to Bridge for each fund pursuant to the fund agreements as if the fair value of the underlying investments were realized as of such date, irrespective of whether such amounts have been realized. As the fair value of underlying investments varies between reporting periods, it is necessary to make adjustments to amounts recorded as accrued performance allocations to reflect either (a) positive performance resulting in an increase in the accrued performance allocation to the general partner, or (b) negative performance that would cause the amount due to Bridge to be less than the amount previously recognized as revenue, resulting in a negative adjustment to the accrued performance allocation to the general partner. In each scenario, it is necessary to calculate the accrued performance allocation on cumulative results compared to the accrued performance allocation recorded to date and make the required positive or negative adjustments. Bridge ceases to record negative performance allocations once previously accrued performance allocations for such fund have been fully reversed. Bridge is not obligated to pay guaranteed returns or hurdles in this situation, and therefore, cannot have negative performance allocations over the life of a fund. The carrying amounts of equity method investments are reflected in investments in the consolidated and combined balance sheets.
Other Investments — A non-controlling, unconsolidated ownership interest in an entity may be accounted for using one of: (i) equity method where applicable; (ii) fair value option if elected; (iii) fair value through earnings if fair value is readily determinable, including election of NAV practical expedient where applicable; or (iv) for equity investments without readily determinable fair values, the measurement alternative to measure at cost adjusted for any impairment and observable price changes, as applicable. Changes in fair value of equity method investments are recorded in investment income (loss) in the consolidated and combined statements of operations.
85
Equity Method Investments
The Company accounts for investments under the equity method of accounting if it has the ability to exercise significant influence over the operating and financial policies of an entity but does not have a controlling financial interest. The equity method investment is initially recorded at cost and adjusted each period for capital contributions, distributions and the Company’s share of the entity’s net income or loss as well as other comprehensive income or loss.
For certain equity method investments, the Company records its proportionate share of income on a one to three-month lag. Distributions of operating profits from equity method investments are reported as operating activities, while distributions in excess of operating profits are reported as investing activities in the consolidated and combined statements of cash flows under the cumulative earnings approach.
Impairment
Evaluation of impairment applies to equity method investments and equity investments under the measurement alternative. If indicators of impairment exist, the Company will estimate the fair value of its investment. In assessing fair value, the Company generally considers, among others, the estimated enterprise value of the investee or fair value of the investee’s underlying net assets, including net cash flows to be generated by the investee as applicable, and for equity method investees with publicly traded equity, the traded price of the equity securities in an active market.
For investments under the measurement alternative, if the carrying value of the investment exceeds its fair value, an impairment is deemed to have occurred.
For equity method investments, further consideration is made if a decrease in value of the investment is other-than-temporary to determine if impairment loss should be recognized. Assessment of other-than-temporary impairment involves management judgment, including, but not limited to, consideration of the investee’s financial condition, operating results, business prospects and creditworthiness, the Company’s ability and intent to hold the investment until recovery of its carrying value, or a significant and prolonged decline in traded price of the investee’s equity security. If management is unable to reasonably assert that an impairment is temporary or believes that the Company may not fully recover the carrying value of its investment, then the impairment is considered to be other-than-temporary.
86
Goodwill — The Company has goodwill of $
The Company also tests goodwill for impairment in other periods if an event occurs or circumstances change such that is more likely than not to reduce the fair value of the reporting unit below its carrying amount. Inherent in such fair value determinations are certain judgments and estimates relating to future cash flows, including the Company’s interpretation of current economic indicators and market valuations, and assumptions about the Company’s strategic plans with regard to its operations. Due to the uncertainties associated with such estimates, actual results could differ from such estimates.
Deferred Tax Assets — Deferred tax assets is primarily comprised of the TRA between the Operating Company and each of the Continuing Equity Owners as discussed subsequently in “Tax Receivable Agreement,” and deferred income taxes related to the operations of BIGRM.
Accounts Payable and Accrued Expenses — Accounts payables and accrued expenses include payables to vendors, interest payable, and payables to the properties and funds during the normal course of business.
Other Liabilities — Other liabilities include unearned management fees, advanced payments and short-term deferred rent obligations.
Other Long-term Liabilities — Other long-term liabilities include long-term deferred rent obligations and lease incentives.
Business Combinations
Definition of a Business — The Company evaluates each purchase transaction to determine whether the acquired assets meet the definition of a business. If substantially all of the fair value of gross assets acquired is concentrated in a single identifiable asset or a group of similar identifiable assets, then the set of transferred assets and activities is not a business. If not, for an acquisition to be considered a business, it would have to include an input and a substantive process that together significantly contribute to the ability to create outputs (i.e., there is a continuation of revenue before and after the transaction). A substantive process is not ancillary or minor, cannot be replaced without significant costs, effort or delay or is otherwise considered unique or scarce. To qualify as a business without outputs, the acquired assets would require an organized workforce with the necessary skills, knowledge and experience that performs a substantive process.
Asset Acquisition — For acquisitions that are not deemed to be businesses, the assets acquired are recognized based on their cost to the Company as the acquirer and no gain or loss is recognized. The cost of assets acquired in a group is allocated to individual assets within the group based on their relative fair values and does not give rise to goodwill. Transaction costs related to acquisition of assets are included in the cost basis of the assets acquired.
Acquisitions of Business — The Company accounts for acquisitions that qualify as business combinations by applying the acquisition method. Transaction costs related to acquisition of a business are expensed as incurred and excluded from the fair value of consideration transferred. The identifiable assets acquired, liabilities assumed and non-controlling interests in an acquired entity are recognized and measured at their estimated fair values. The excess of the fair value of consideration transferred over the fair values of identifiable assets acquired, liabilities assumed and non-controlling interests in an acquired entity, net of fair value of any previously held interest in the acquired entity, is recorded as goodwill. Such valuations require management to make significant estimates and assumptions.
87
Revenue Recognition — Revenues consist of fund management fees, property management and leasing fees, construction management fees, development fees, transaction fees, insurance premiums and other asset management and property income. The Company recognizes revenue in a way that depicts the transfer of promised goods or services to customers in an amount that reflects the consideration to which the Company expects to be entitled in exchange for those goods or services. The Company’s revenue is based on contracts with a determinable transaction price and distinct performance obligations with probable collectability. Revenues are not recognized until the performance obligation(s) are satisfied.
Fund Management Fees
Fund management fees are generally based on a defined percentage of total commitments, invested capital or NAV of the investment portfolios managed by the Fund Managers. Following the expiration or termination of the investment period, the basis on which management fees are earned for certain closed-end funds and managed accounts, generally changes from committed capital to invested capital with no change in the management fee rate. The fees are generally based on a quarterly measurement period and amounts are paid in advance of recognizing revenue. Fund management fees are recognized as revenue in the period advisory services are rendered, subject to our assessment of collectability. Fund management fees also include management fees for joint ventures and separately managed accounts. For Company-sponsored closed-end funds, the capital raising period is generally 18 to 24 months. The Fund Managers charge catch-up management fees to investors who subscribe in later closings in amounts equal to the fees they would have paid if they had been in the initial closing (plus interest as if the investor had subscribed in the initial closing). Catch-up management fees are recognized in the period in which the limited partner subscribes to the fund. Fund management fees are presented net of placement agent fees, where Bridge is acting as an agent in the arrangement.
Property Management and Leasing Fees
Property management fees are earned as the related services are provided under the terms of the respective property management agreements. Included in management fees are certain expense reimbursements where the Company is considered the principal under the agreements and is required to record the expense and related reimbursement revenue on a gross basis. The Company also earns revenue associated with the leasing of commercial assets, which is recognized upon the execution of the lease agreement.
Construction Management Fees
Construction management fees are earned as the services are provided under the terms of the construction management agreement with each property.
Development Fees
Development fees are earned as the services are provided under the terms of the development agreement with each asset.
Transaction Fees
The Company earns transaction fees associated with the due diligence related to the acquisition of assets and origination of debt financing of assets. The fees are recognized upon the acquisition of the asset or origination of the mortgage or other debt, as applicable.
Insurance Premiums
BIGRM insures multifamily and commercial properties owned by the funds. BIGRM provides insurance for direct risks including lease security deposit fulfillment, tenant legal liability, workers compensation deductible, property deductible and general liability deductible reimbursements. Tenant liability premiums are earned monthly. Deposit eliminator premiums are earned in the month that they are written. Workers’ compensation and property deductible premiums are earned over the terms of the policy period.
Other Asset Management and Property Income
Other Asset Management and Property Income is comprised of, among other things interest on catch-up management fees, fees related to in-house legal and tax professional fees, which is generally billed on an hourly rate to various Bridge funds and properties and other miscellaneous fees.
88
Investment Income (inclusive of incentive fees and performance allocation)
Performance income is based on certain specific hurdle rates as defined in the applicable investment management agreements or fund or joint venture governing documents. Substantially all performance income is earned from funds and joint ventures managed by affiliates of the Company.
Incentive Fees
Incentive fees comprise fees earned from certain fund investor investment mandates for which the Company does not have a general partner interest in a fund. The Company recognizes incentive fee revenue only when these amounts are realized and no longer subject to significant reversal, which is typically at the end of a defined performance period and/or upon expiration of the associated clawback period.
Performance Allocation
The Company accounts for accrued performance obligations, which represents a performance-based capital allocation from a fund General Partner to the Company, as earnings from financial assets within the scope of ASC 323, Investments—Equity Method and Joint Ventures. The underlying investments in the funds upon which the allocation is based reflect valuations on a three-month lag. The Company recognizes performance allocation as a separate revenue line item in the consolidated and combined statements of operations with uncollected carried interest as of the reporting date reported within investments in the consolidated and combined balance sheet.
Carried interest is allocated to the Company based on cumulative fund performance to date, subject to the achievement of minimum return levels in accordance with the respective terms set out in each fund’s partnership agreement or other governing documents. At the end of each reporting period, a fund will allocate carried interest applicable to the Company based upon an assumed liquidation of that fund’s net assets on the reporting date, irrespective of whether such amounts have been realized. Carried interest is recorded to the extent such amounts have been allocated and may be subject to reversal to the extent that the amount allocated exceeds the amount due to the general partner based on a fund’s cumulative investment returns. Accordingly, the amount recognized as performance allocation revenue reflects our share of the gains and losses of the associated fund’s underlying investments measured at their then-fair values, relative to the fair values as of the end of the prior period.
As the fair value of underlying assets varies between reporting periods, it is necessary to make adjustments to amounts recorded as carried interest to reflect either (i) positive performance resulting in an increase in the carried interest allocated to the Company or (ii) negative performance that would cause the amount due to the Company to be less than the amount previously recognized as revenue, resulting in a reversal of previously recognized performance interest allocated to the Company. Accrued but unpaid carried interest as of the reporting date is recorded within accrued performance allocations compensation in the consolidated and combined balance sheet.
Carried interest is realized when an underlying investment is profitably disposed of, and the fund’s cumulative returns are in excess of the specific hurdle rates as defined in the applicable investment management agreements, fund or joint venture governing documents. Since accrued performance allocation is subject to reversal, the Company may need to accrue for potential repayment of previously received carried interest. This accrual represents all amounts previously distributed to the Company that would need to be repaid to the funds if the funds were to be liquidated based on the current fair value of the underlying funds’ investments as of the reporting date. The actual repayment obligations, however, generally do not become realized until the end of a fund’s life.
Performance Allocations Compensation — A portion of performance allocations earned is awarded to employees. The Company evaluates performance allocations to determine if they are compensatory awards or equity-classified awards based on the underlying terms of the award agreements on the grant date.
89
Performance allocation awards granted to employees and other participants are accounted for as a component of compensation and benefits expense contemporaneously with our recognition of the related realized and unrealized performance allocation revenue. Upon a reversal of performance allocation revenue, the related compensation expense, if any, is also reversed. Liabilities recognized for performance allocations due to affiliates are not paid until the related performance allocation revenue is realized.
The Company records incentive fee compensation when it is probable that a liability has been incurred and the amount is reasonably estimable. The incentive fee compensation accrual is based on a number of factors, including the cumulative activity for the period and the expected timing of the distribution of the net proceeds in accordance with the applicable governing agreement. There was $
Investment Income (Loss) — Investment income (loss) occurs when the Company redeems all or a portion of its investment or when the Company receives cash income, such as dividends or distributions. Unrealized appreciation (depreciation) results from changes in the fair value of the underlying investment as well as from the reversal of previously recognized unrealized appreciation (depreciation) at the time an investment is realized. The Company’s share of the investee’s income and expenses for the Company’s equity method investments (exclusive of performance allocations) is also included within investment income (loss).
The realized and unrealized change in gain (loss) associated with the financial instruments that we elect the fair value option is also included in investment income (loss).
Interest Income — Interest (other than interest on catch-up management fees), dividends and other investment income are included in interest income. Interest income is recognized on an accrual basis to the extent that such amounts are expected to be collected using the effective interest method. Dividends and other investment income are recorded when the right to receive payment is established.
Foreign Currency — The U.S. dollar is the Company’s functional currency; however, certain transactions of the Company may not be denominated in U.S. dollars. Foreign exchange revaluation arising from these transactions is recognized within other income (loss) in the consolidated and combined statements of operations. For the years ended December 31, 2021, 2020, and 2019, transaction losses related to foreign currencies revaluation were immaterial.
Income Taxes — Prior to our becoming a public company, other than our subsidiaries BIGRM and BPM, the Company and its subsidiaries were limited liability companies or limited partnerships and, as such, were not subject to income taxes and the individual owners of Bridge were required to report their distributive share of the Company’s realized income, gains, losses, deductions, or credits on their individual income tax returns. Following our IPO, the Company became a corporation for U.S. federal income tax purposes and therefore is subject to U.S. federal and state income taxes on its share of taxable income generated by the Operating Company.
The Operating Company is treated as a pass-through entity for U.S. federal and state income tax purposes. As such, income generated by the Operating Company flows through to its members, including the Company, and is generally not subject to U.S. federal or state income tax at the level of the Operating Company. The Operating Company’s non-U.S. subsidiaries generally operate as corporate entities in non-U.S. jurisdictions, with certain of these entities subject to local or non-U.S. income taxes. Additionally, certain subsidiaries are subject to local jurisdiction taxes at the entity level, with the related tax provision reflected in the consolidated and combined statements of operations. As a result, the Operating Company does not generally record U.S. federal and state income taxes on its income or that of its subsidiaries, except for certain local and foreign income taxes discussed above.
90
Taxes are accounted for using the asset and liability method of accounting. Under this method, deferred tax assets and liabilities are recognized for the expected future tax consequences of differences between the carrying amounts of assets and liabilities and their respective tax bases, using tax rates in effect for the year in which the differences are expected to reverse. The effect of a change in tax rates on deferred tax assets and liabilities is recognized in income in the period when the change is enacted. The principal items giving rise to temporary differences are certain basis differences resulting from exchanges of units in the Operating Company.
Deferred tax assets are reduced by a valuation allowance when it is more likely than not that some portion or all of the deferred tax assets will not be realized. The realization of deferred tax assets is dependent on the amount, timing and character of the Company’s future taxable income. When evaluating the realizability of deferred tax assets, all evidence – both positive and negative – is considered. This evidence includes, but is not limited to, expectations regarding future earnings, future reversals of existing temporary tax differences and tax planning strategies.
The Company is subject to the provisions of ASC Subtopic 740-10, Accounting for Uncertainty in Income Taxes. This standard establishes consistent thresholds as it relates to accounting for income taxes. It defines the threshold for recognizing the benefits of tax return positions in the financial statements as more likely than not to be sustained by the relevant taxing authority and requires measurement of a tax position meeting the more likely than not criterion, based on the largest benefit that is more than 50% likely to be realized. If upon performance of an assessment pursuant to this subtopic, management determines that uncertainties in tax positions exist that do not meet the minimum threshold for recognition of the related tax benefit, a liability is recorded in the consolidated and combined financial statements. The Company recognizes interest and penalties, if any, related to unrecognized tax benefits as general, administrative and other expenses in the consolidated and combined statements of operations. See Note 17, “Income Taxes,” for more information.
Other than BIGRM and BPM, the Operating Company and its subsidiaries are limited liability companies and partnerships, as such, are not subject to income taxes; the individual members of the Operating Company are required to report their distributive share of the Operating Company’s realized income, gains, losses, deductions, or credits on their individual income tax returns.
Tax Receivable Agreement — In connection with the IPO, the Company entered into a TRA with the Operating Company and each of the Continuing Equity Owners that provides for the payment by the Company to the Continuing Equity Owners of
Comprehensive Income — Other comprehensive income consists of net income and other appreciation (depreciation) affecting the Company that, under GAAP, are excluded from net income. The Company’s other comprehensive income includes foreign currency translation adjustments.
Segments — The Company operates as one business, a fully integrated real estate investment manager. The Company's chief operating decision maker, which is the executive chairman, utilizes a consolidated approach to asses financial performance and allocate resources. As such, the Company operates as one business segment.
Earnings Per Share — Basic earnings per share is calculated by dividing net income available to Class A common stockholders by the weighted-average number of Class A common shares outstanding for the period.
Diluted earnings per share of Class A common stock is computed by dividing net income available to Class A common stockholders after giving consideration to the reallocation of net income between holders of Class A common stock and non-controlling interests, by the weighted-average number of shares of Class A common stock outstanding during the period adjusted to give effect to potentially dilutive securities, if any. Potentially dilutive securities include unvested Restricted Stock Awards, RSUs, and Class A Units exchangeable on a one-for-one basis with shares of Class A common stock. The effect of potentially dilutive securities is reflected in diluted earnings per share of Class A common stock using the more dilutive result of the treasury stock method or the two-class method.
91
Unvested share-based payment awards, including Restricted Stock and RSUs, that contain non-forfeitable rights to dividends (whether paid or unpaid) are participating securities. Outstanding Class A Units are also considered participating securities. As a result of being participating securities, Restricted Stock Awards, RSUs and Class A Units are considered in the computation of earnings per share of Class A common stock pursuant to the two-class method.
Recently Adopted Accounting Standards
Consolidation — In October 2018, the Financial Accounting Standards Board (“FASB”) issued Accounting Standard Update (“ASU”) 2018-17, an update to ASC Topic 810, Consolidations. ASU 2018-17 requires reporting entities to consider indirect interests held by related parties under common control on a proportional basis rather than as the equivalent of a direct interest in its entirety in determining whether a decision-making fee is a variable interest. ASU 2018-17 is effective for interim and annual reporting periods in fiscal years that begin after December 15, 2019, with early adoption permitted. The Company adopted the provisions of ASU 2018-17 on January 1, 2020. This adoption did not have an impact on the consolidated and combined financial statements.
Fair Value — In August 2018, the FASB issued ASU No. 2018-13, Fair Value Measurement (Topic 820): Disclosure Framework—Changes to the Disclosure Requirements for Fair Value Measurements. The ASU requires new disclosures of changes in unrealized gains and losses in other comprehensive income for recurring Level 3 fair value measurements of instruments held at balance sheet date, as well as the range and weighted-average or other quantitative information, if more relevant, of significant unobservable inputs for recurring and nonrecurring Level 3 fair values. Certain previously required disclosures are eliminated, specifically around the valuation process required for Level 3 fair values, policy for timing of transfers between levels of the fair value hierarchy, as well as amounts and reason for transfers between Levels 1 and 2. Additionally, the new guidance clarifies or modifies certain existing disclosures, including clarifying that information about measurement uncertainty of Level 3 fair values should be as of reporting date and requiring disclosures of the timing of liquidity events for investments measured under the NAV practical expedient, but only if the investee has communicated this information or has announced it publicly. The provisions on new disclosures and modification to disclosure of Level 3 measurement uncertainty are to be applied prospectively, while all other provisions are to be applied retrospectively. ASU No. 2018-13 was effective January 1, 2020. The adoption of this standard did not have a material effect on the Company’s existing disclosures (see Note 8, “Fair Value Measurements,” for additional information).
Income Taxes — In December 2019, the FASB issued ASU 2019-12, Income Taxes (Topic 740): Simplifying the Accounting for Income Taxes. The amendments in this update simplify the accounting for income taxes by removing certain exceptions to the general principles in Topic 740. The amendments also improve consistent application of and simplify GAAP for other areas of Topic 740 by clarifying and amending existing guidance. ASU 2019-12 is effective for public entities for annual reporting periods beginning after December 15, 2020 and interim periods within those reporting periods, with early adoption permitted. The amendments in this update related to separate financial statements of legal entities that are not subject to tax should be applied on a retrospective basis for all periods presented. The amendments related to changes in ownership of foreign equity method investments or foreign subsidiaries should be applied on a modified retrospective basis through a cumulative-effect adjustment to retained earnings as of the beginning of the fiscal year of adoption. The amendments related to franchise taxes that are partially based on income should be applied on either a retrospective basis for all periods presented or a modified retrospective basis through a cumulative-effect adjustment to retained earnings as of the beginning of the fiscal year of adoption. All other amendments should be applied on a prospective basis. The adoption of this standard on January 1, 2021 did not have a material effect on the Company’s consolidated and combined financial statements.
Recent Accounting Pronouncements (Not Yet Adopted)
In February 2016, the FASB issued ASU 2016-02, Leases (Topic 842). ASU 2016-02 requires an entity to recognize right-of-use assets and lease liabilities on its balance sheet for all leases and to disclose certain information about leasing arrangements. Lessees and lessors are required to disclose qualitative and quantitative information about leasing arrangements to enable a user of the financial statements to assess the amount, timing and uncertainty of cash flows arising from leases. For public business entities, ASU 2016-02 was effective for annual reporting periods beginning after December 15, 2018. On June 3, 2020, the FASB extended the adoption date for all other entities, including emerging growth companies (“EGCs”), as defined by the U.S. Securities and Exchange Commission (“SEC”), that have elected to defer adoption until the standard is effective for non-public business entities, to annual periods beginning after December 15, 2021, and interim periods within annual periods beginning after December 15, 2022, with early adoption permitted. The Company qualifies as an EGC and has elected to take advantage of the extended transition period afforded to EGCs as it applies to the adoption of new accounting standards.
92
The Company adopted the standard on January 1, 2022, using the modified retrospective method. As a result of the adoption of ASU 2016-02, the Company recorded a right of use asset and lease liability of approximately
In July 2018, the FASB issued ASU 2018-11, Targeted Improvements to Topic 842, Leases. This guidance allows entities to not apply the new lease standard in the comparative periods they present in their financial statements in the year of adoption. In addition, this guidance provides lessors with a practical expedient to not separate non-lease components from the associated lease components when certain criteria is met. These improvements are to be applied upon transition of Topic 842. The Company adopted the practical expedient on January 1, 2022, which provides the Company the option to apply the new guidance at its effective date (January 1, 2022) without having to adjust the 2021 comparative financial statements.
In June 2016, the FASB issued ASU 2016-13, Financial Instruments—Credit Losses, which changes the accounting for recognizing impairments of financial assets. Under this guidance, credit losses for certain types of financial instruments will be estimated based on expected losses. The guidance also modifies the impairment models for available-for-sale debt securities and purchased financial assets with credit deterioration since their origination. This guidance is effective for annual and interim periods beginning after December 15, 2022 for EGCs that have elected to defer adoption until the guidance becomes effective for non-public entities, with early adoption permitted. The Company does not expect the adoption to have a material impact to our consolidated financial statements.
3.
The Company earns base management fees for the day-to-day operations and administration of its managed private funds and other investment vehicles. Other revenue sources include insurance premiums, other asset management and property income and are described in Note 2, “Significant Accounting Policies.”
FUND MANAGEMENT FEES |
|
Year Ended December 31, |
|
|||||||||
(in thousands) |
|
2021 |
|
|
2020 |
|
|
2019 |
|
|||
Funds |
|
$ |
|
|
$ |
|
|
$ |
|
|||
Joint ventures and separately managed accounts |
|
|
|
|
|
|
|
|
|
|||
Total fund management fees |
|
$ |
|
|
$ |
|
|
$ |
|
|||
PROPERTY MANAGEMENT AND LEASING FEES |
|
Year Ended December 31, |
|
|||||||||
(in thousands) |
|
2021 |
|
|
2020 |
|
|
2019 |
|
|||
Seniors Housing |
|
$ |
|
|
$ |
|
|
$ |
|
|||
Multifamily |
|
|
|
|
|
|
|
|
|
|||
Office |
|
|
|
|
|
|
|
|
|
|||
Total property management and leasing fees |
|
$ |
|
|
$ |
|
|
$ |
|
|||
CONSTRUCTION MANAGEMENT FEES |
|
Year Ended December 31, |
|
|||||||||
(in thousands) |
|
2021 |
|
|
2020 |
|
|
2019 |
|
|||
Multifamily |
|
$ |
|
|
$ |
|
|
$ |
|
|||
Office |
|
|
|
|
|
|
|
|
|
|||
Seniors Housing |
|
|
|
|
|
|
|
|
|
|||
Total construction management fees |
|
$ |
|
|
$ |
|
|
$ |
|
|||
TRANSACTION FEES |
|
Year Ended December 31, |
|
|||||||||
(in thousands) |
|
2021 |
|
|
2020 |
|
|
2019 |
|
|||
Acquisition fees |
|
$ |
|
|
$ |
|
|
$ |
|
|||
Brokerage fees |
|
|
|
|
|
|
|
|
|
|||
Total transaction fees |
|
$ |
|
|
$ |
|
|
$ |
|
|||
93
For the years ended December 31, 2021, 2020, and 2019, no individual client represented
As of December 31, 2021, 2020 and 2019, the Company had $
4.
The Company invests a portion of the premiums received at BIGRM in exchange traded funds and mutual funds. As of December 31, 2021 and 2020, the Company’s investment securities are summarized as follows:
|
|
|
|
|
Unrealized |
|
|
Unrealized |
|
|
Fair |
|
||||
(in thousands) |
|
Cost |
|
|
Gains |
|
|
Losses |
|
|
Value |
|
||||
December 31, 2021: |
|
|
|
|
|
|
|
|
|
|
|
|
||||
Exchange traded funds |
|
$ |
|
|
$ |
|
|
$ |
( |
) |
|
$ |
|
|||
Mutual funds |
|
|
|
|
|
|
|
|
( |
) |
|
|
|
|||
Total marketable securities |
|
$ |
|
|
$ |
|
|
$ |
( |
) |
|
$ |
|
|||
|
|
|
|
|
|
|
|
|
|
|
|
|
||||
December 31, 2020: |
|
|
|
|
|
|
|
|
|
|
|
|
||||
Exchange traded funds |
|
$ |
|
|
$ |
|
|
$ |
|
|
$ |
|
||||
Mutual funds |
|
|
|
|
|
|
|
|
|
|
|
|
||||
Total marketable securities |
|
$ |
|
|
$ |
|
|
$ |
|
|
$ |
|
||||
5. INVESTMENTS
As of December 31, 2021, the Company had interests in 140 partnership or joint venture entities. The limited liability companies and limited partnerships in which the Company is the general partner are generally engaged directly or indirectly in the acquisition, development, operation and ownership of real estate. The accounting principles of these entities are substantially the same as those of the Company. Additionally, the Company has direct investments in several funds, including certain Bridge-sponsored funds.
|
|
|
|
Carrying Value |
|
|||||
(in thousands) |
|
|
|
December 31, |
|
|
December 31, |
|
||
Investments |
|
|
|
2021 |
|
|
2020 |
|
||
Accrued performance allocations |
|
(1) |
|
$ |
|
|
$ |
|
||
|
|
|
|
|
|
|
|
|
||
Other investments: |
|
|
|
|
|
|
|
|
||
Partnership interests in Company-sponsored funds |
|
(2) |
|
|
|
|
|
|
||
Investments in third-party partnerships |
|
(3) |
|
|
|
|
|
|
||
Other |
|
(4) |
|
|
|
|
|
|
||
Total other investments |
|
|
|
$ |
|
|
$ |
|
||
(1) Represents an investment in carried interest in the funds. There is a disproportionate allocation of returns to the Company as general partner or equivalent based on the extent to which cumulative performance of the fund exceeds minimum return hurdles. Investment is valued using NAV of the respective vehicle.
(2) Partnership interests in Company-sponsored funds are valued using NAV of the respective vehicle.
(3) Investments in limited partnership interests in third-party private proptech venture capital firms are valued using NAV of the respective vehicle.
The Company recognized investment income of $
Of the total accrued carried interest allocations balance as of December 31, 2021 and 2020, $
94
The Company evaluates each of its equity method investments, excluding Accrued Performance Allocations, to determine if any were significant as defined by the SEC. As of and for the years ended December 31, 2021, 2020 and 2019, no individual equity method investment held by the Company met the significance criteria. As a result, the Company is not required to provide separate financial statements for any of its equity method investments.
6. NOTES RECEIVABLE
Notes Receivable From Affiliates
As of December 31, 2021 and 2020, the Company had the following short-term notes receivable from affiliates outstanding:
|
|
December 31, |
|
|||||
(in thousands) |
|
2021 |
|
|
2020 |
|
||
Bridge Multifamily Fund V |
|
$ |
|
|
$ |
|
||
Bridge Logistics U.S. Venture I |
|
|
|
|
|
|
||
Bridge Seniors Housing Fund III |
|
|
|
|
|
|
||
Bridge Office Fund II |
|
|
|
|
|
|
||
Bridge Seniors Housing Fund I |
|
|
|
|
|
|
||
Bridge Seniors Housing Fund II |
|
|
|
|
|
|
||
Bridge Debt Strategies Fund I |
|
|
|
|
|
|
||
Total |
|
$ |
|
|
$ |
|
||
As of December 31, 2021, interest on these loans accrued at a fixed rate of
The Company had interest receivable balances on these notes as of December 31, 2021 and 2020 totaling $
Notes Receivable From Employees
During 2021, the Company executed multiple notes with employees, none of whom are officers or immediate family members of officers, to invest in the Company or the Operating Company. As of December 31, 2021, the aggregate outstanding principal amount outstanding was $
As of December 31, 2020, the Company had multiple notes with employees with an aggregate outstanding principal amount of $
95
7. PREPAID AND OTHER CURRENT ASSETS
(in thousands) |
|
December 31, |
|
|||||
Entity |
|
2021 |
|
|
2020 |
|
||
Deposits |
|
$ |
|
|
$ |
|
||
Prepaid insurance |
|
|
|
|
|
|
||
Other prepaid expenses |
|
|
|
|
|
|
||
Premiums receivable |
|
|
|
|
|
|
||
Other current assets |
|
|
|
|
|
|
||
Total |
|
$ |
|
|
$ |
|
||
As of December 31, 2021, the deposits were primarily attributed to an acquisition that closed in January 2022 (discussed in Note 25, “Subsequent Events”). Prepaid insurance mainly consists of prepaid Director and Officer insurance. Other prepaid expenses consisted of prepaid taxes, prepaid software licenses, and other miscellaneous prepaid expenses. Premiums receivable are related to BIGRM.
8. FAIR VALUE MEASUREMENTS
Exchange traded funds: Valued using the market price of the fund as of the consolidated and combined balance sheet dates, December 31, 2021 and 2020. Exchange traded funds valued using quoted prices are classified within Level 1 of the fair value hierarchy.
Mutual funds: Valued at the number of shares of the underlying fund multiplied by the closing NAV per share quoted by that fund as of the consolidated and combined balance sheet dates, December 31, 2021 and 2020. The value of the specific funds the Company has invested in are validated with a sufficient level of observable activity to support classification of the fair value measurement as Level 1 in the fair value hierarchy.
Accrued performance allocations and partnership interests: The Company generally values its investments in accrued performance allocations and partnership interests using the NAV per share equivalent calculated by the investment manager as a practical expedient to determining an independent fair value. The Company does not categorize within the fair value hierarchy investments where fair value is measured using the NAV per share practical expedient.
Other Investments: Investments are accounted for using the measurement alternative to measure at cost adjusted for any impairment and observable price changes. Unrealized gains or losses on other investments are included in investment income (loss) on the consolidated and combined statements of operations.
General Partner Notes Payable: Valued using the NAV per share equivalent calculated by the investment manager as a practical expedient to determining an independent fair value.
The preceding methods described may produce a fair value calculation that may not be indicative of net realizable value or reflective of future fair values. Furthermore, although the Company believes its valuation methods are appropriate and consistent with other market participants, the use of different methodologies or assumptions to determine the fair value of certain financial instruments could result in a different fair value measurement at the reporting date.
96
The following table presents assets that are measured at fair value on a recurring basis as of December 31, 2021 and 2020:
|
|
|
|
|
|
|
|
|
|
|
Measured at |
|
|
|
|
|||||
(in thousands) |
|
Level 1 |
|
|
Level 2 |
|
|
Level 3 |
|
|
NAV |
|
|
Total |
|
|||||
As of December 31, 2021 |
|
|
|
|
|
|
|
|
|
|
|
|
|
|
|
|||||
Assets: |
|
|
|
|
|
|
|
|
|
|
|
|
|
|
|
|||||
Exchange traded funds |
|
$ |
|
|
$ |
— |
|
|
$ |
— |
|
|
$ |
— |
|
|
$ |
|
||
Mutual funds |
|
|
|
|
|
— |
|
|
|
— |
|
|
|
— |
|
|
|
|
||
Accrued performance allocations |
|
|
— |
|
|
|
— |
|
|
|
— |
|
|
|
|
|
|
|
||
Partnership interests |
|
|
— |
|
|
|
— |
|
|
|
— |
|
|
|
|
|
|
|
||
Other investments |
|
|
— |
|
|
|
— |
|
|
|
|
|
|
— |
|
|
|
|
||
Total assets at fair value |
|
$ |
|
|
$ |
— |
|
|
$ |
|
|
$ |
|
|
$ |
|
||||
|
|
|
|
|
|
|
|
|
|
|
|
|
|
|
|
|||||
Liabilities: |
|
|
|
|
|
|
|
|
|
|
|
|
|
|
|
|||||
General Partner Notes Payable |
|
$ |
— |
|
|
$ |
— |
|
|
$ |
— |
|
|
$ |
|
|
$ |
|
||
|
|
|
|
|
|
|
|
|
|
|
|
|
|
|
|
|||||
As of December 31, 2020 |
|
|
|
|
|
|
|
|
|
|
|
|
|
|
|
|||||
Assets: |
|
|
|
|
|
|
|
|
|
|
|
|
|
|
|
|||||
Exchange traded funds |
|
$ |
|
|
$ |
— |
|
|
$ |
— |
|
|
$ |
— |
|
|
$ |
|
||
Mutual funds |
|
|
|
|
|
— |
|
|
|
— |
|
|
|
— |
|
|
|
|
||
Accrued performance allocations |
|
|
— |
|
|
|
— |
|
|
|
— |
|
|
|
|
|
|
|
||
Partnership interests |
|
|
— |
|
|
|
— |
|
|
|
— |
|
|
|
|
|
|
|
||
Other investments |
|
|
— |
|
|
|
— |
|
|
|
|
|
|
— |
|
|
|
|
||
Total assets at fair value |
|
$ |
|
|
$ |
— |
|
|
$ |
|
|
$ |
|
|
$ |
|
||||
|
|
|
|
|
|
|
|
|
|
|
|
|
|
|
|
|||||
Liabilities: |
|
|
|
|
|
|
|
|
|
|
|
|
|
|
|
|||||
General Partner Notes Payable |
|
$ |
— |
|
|
$ |
— |
|
|
$ |
— |
|
|
$ |
|
|
$ |
|
||
The following table presents a rollforward of Level 3 assets at cost adjusted for any impairment and observable price changes:
|
Other |
|
|
(in thousands) |
Investments |
|
|
Balance as of December 31, 2019 |
$ |
|
|
Net unrealized gains |
|
( |
) |
Balance as of December 31, 2020 |
|
|
|
Purchases |
|
|
|
Net unrealized gains |
|
|
|
Balance as of December 31, 2021 |
$ |
|
|
97
The following table presents assets measured at fair value using NAV:
|
|
|
|
|
Unfunded |
|
||
(in thousands) |
|
Fair Value |
|
|
Commitments |
|
||
December 31, 2021: |
|
|
|
|
|
|
||
Accrued performance allocations |
|
$ |
|
|
$ |
|
||
|
|
|
|
|
|
|
||
Partnership interests: |
|
|
|
|
|
|
||
Company-sponsored open-end fund |
|
|
|
|
|
|
||
Company-sponsored closed-end funds |
|
|
|
|
|
|
||
Third-party closed-end funds |
|
|
|
|
|
|
||
Total partnership interests |
|
$ |
|
|
$ |
|
||
|
|
\ |
|
|
|
|
||
December 31, 2020: |
|
|
|
|
|
|
||
Accrued performance allocations |
|
$ |
|
|
$ |
|
||
|
|
|
|
|
|
|
||
Partnership interests: |
|
|
|
|
|
|
||
Company-sponsored open-end fund |
|
|
|
|
|
|
||
Company-sponsored closed-end funds |
|
|
|
|
|
|
||
Third-party closed-end funds |
|
|
|
|
|
|
||
Total partnership interests |
|
$ |
|
|
$ |
|
||
The Company can redeem its investment in the Company-sponsored open-end fund with a 60-day notice. The Company’s interests in its closed-end funds are not subject to redemption, with distributions to be received through liquidation of underlying investments of the funds. The closed-end funds generally have -to-
Fair Value Information of Financial Instruments Reported at Cost
The carrying values of cash, accounts receivable, due from and to affiliates, interest payable and accounts payable approximate fair value due to their short-term nature and negligible credit risk.
|
|
|
|
|
|
|
|
|
|
|
|
|
|
Carrying |
|
|||||
(in thousands) |
|
Level 1 |
|
|
Level 2 |
|
|
Level 3 |
|
|
Total |
|
|
Value |
|
|||||
As of December 31, 2021: |
|
|
|
|
|
|
|
|
|
|
|
|
|
|
|
|||||
Notes payable (private notes) |
|
$ |
|
|
$ |
|
|
$ |
|
|
$ |
|
|
$ |
|
|||||
|
|
|
|
|
|
|
|
|
|
|
|
|
|
|
|
|||||
As of December 31, 2020: |
|
|
|
|
|
|
|
|
|
|
|
|
|
|
|
|||||
Notes payable (private notes) |
|
$ |
|
|
$ |
|
|
$ |
|
|
$ |
|
|
$ |
|
|||||
Fair values of the Private Notes were estimated by discounting expected future cash outlays at interest rates available to the Company for similar instruments.
9.
The following table presents the balances per asset class as of December 31, 2021 and 2020:
|
|
December 31, |
|
|||||
(in thousands) |
|
2021 |
|
|
2020 |
|
||
Tenant improvements |
|
$ |
|
|
$ |
|
||
Office furniture |
|
|
|
|
|
|
||
Office equipment |
|
|
|
|
|
|
||
Computer equipment |
|
|
|
|
|
|
||
Total tenant improvements, furniture and equipment |
|
|
|
|
|
|
||
Accumulated depreciation |
|
|
( |
) |
|
|
( |
) |
Tenant improvements, furniture and equipment, net |
|
$ |
|
|
$ |
|
||
98
Depreciation expense for the Company was $
10.
The Company amortizes its intangible assets from its business combinations over
Summarized below are the carrying values for the major classes of intangible assets as of December 31, 2021 and 2020:
|
|
Weighted |
|
Gross |
|
|
|
|
|
Net |
|
|||
|
|
Average |
|
Carrying |
|
|
Accumulated |
|
|
Carrying |
|
|||
(in thousands) |
|
Life |
|
Amount |
|
|
Amortization |
|
|
Amount |
|
|||
As of December 30, 2021: |
|
|
|
|
|
|
|
|
|
|
|
|||
Customer Lists |
|
|
$ |
|
|
$ |
( |
) |
|
$ |
|
|||
Management Contracts |
|
|
|
|
|
|
( |
) |
|
|
|
|||
Total |
|
|
|
$ |
|
|
$ |
( |
) |
|
$ |
|
||
As of December 31, 2020: |
|
|
|
|
|
|
|
|
|
|
|
|||
Customer Lists |
|
|
$ |
|
|
$ |
( |
) |
|
$ |
|
|||
Management Contracts |
|
|
|
|
|
|
( |
) |
|
|
|
|||
Total |
|
|
|
$ |
|
|
$ |
( |
) |
|
$ |
|
||
The following schedule presents the estimated intangible asset amortization for the following five years commencing on January 1, 2022.
(in thousands) |
|
|
|
|
2022 |
|
$ |
|
|
2023 |
|
|
|
|
2024 |
|
|
|
|
Total |
|
$ |
|
|
11. INSURANCE LOSS RESERVES AND LOSS AND LOSS ADJUSTMENT EXPENSES
BIGRM is a wholly owned subsidiary of Bridge and is licensed under the Utah Captive Insurance Companies Act. BIGRM provides the following insurance policies:
For BIGRM’s insured risks, claim expenses and the related insurance loss reserve liabilities are based on the estimated cost necessary to settle all reported and unreported claims occurring prior to the balance sheet dates. Additionally, claims are expensed when insured events occur or the estimated settlement costs are updated based on the current facts and the reporting date. Additionally, insurance claim expenses and insurance loss reserves include provisions for claims that have occurred but have yet to be reported. Insurance expenses and the insurance loss reserves for both reported and unreported claims are based on the Company’s previous experience and the analysis of a licensed actuary. Management believes such amounts are adequate to cover the ultimate net cost of insured events incurred through the balance sheet date, December 31, 2021. The insurance loss provisions are estimates and the actual amounts may ultimately be settled for a significantly greater or lesser amount. Any subsequent differences arising will be recorded in the period in which they are determined. As of December 31, 2021 and 2020, the Company had reserved $
99
The table below summarizes BIGRM's losses incurred during the years ended December 31, 2021, 2020 and 2019 as well as rollforwards of the loss reserve liability for each of the respective periods then ended.
(in thousands) |
|
Year Ended December 31, |
|
|||||||||
|
|
2021 |
|
|
2020 |
|
|
2019 |
|
|||
Balance as of beginning of year |
|
$ |
|
|
$ |
|
|
$ |
|
|||
Losses incurred, related to: |
|
|
|
|
|
|
|
|
|
|||
Current year |
|
|
|
|
|
|
|
|
|
|||
Prior years |
|
|
( |
) |
|
|
( |
) |
|
|
( |
) |
Total incurred |
|
|
|
|
|
|
|
|
|
|||
|
|
|
|
|
|
|
|
|
|
|||
Losses paid, related to: |
|
|
|
|
|
|
|
|
|
|||
Current year |
|
|
( |
) |
|
|
( |
) |
|
|
( |
) |
Prior years |
|
|
( |
) |
|
|
( |
) |
|
|
( |
) |
Total paid |
|
|
( |
) |
|
|
( |
) |
|
|
( |
) |
Balance as of end of year |
|
$ |
|
|
$ |
|
|
$ |
|
|||
12. SELF-INSURANCE RESERVES
Medical Self-Insurance Reserves — The Company is primarily self-insured for employee health benefits. The Company records its self-insurance liability based on claims filed and an estimate of claims incurred but not yet reported. There is stop-loss coverage for amounts in excess of $
Property and Casualty Reserves — As part of its property management business, the Company arranges for property and casualty risk management for the properties and entities affiliated with the Company (the “Insurance Program”). The Company uses a broker to arrange for insurers to provide coverage deemed necessary by management and required by lenders or property owners. Under the terms of the risk management program, each property has a $
The Risk Management Program for property risks includes a Self-Insured Retention (“SIR”) component in order to more efficiently manage the risks. The Company’s SIR is comprised of a layer of losses that the Company is responsible for satisfying after the properties have met their $
On June 20, 2020, the Company added a general liability self-insured retention aggregate limit of $
As of December 31, 2021 and 2020, the total self-insurance reserve liability was $
100
13. GENERAL PARTNER NOTES PAYABLE
The Bridge GPs traditionally have a General Partner commitment to the respective fund, which is usually satisfied by affiliates direct investment into the funds. For the General Partner commitments for BSH I GP, BMF III GP and BDS I GP, this commitment was satisfied by notes payable (“General Partner Notes Payable”) between the General Partner and certain related parties or outside investors (“GP Lenders”) for reduced management fees. Under the terms of the General Partner Notes Payable, the GP Lender enters into a notes payable with the respective General Partner, which then subscribes to the respective fund for the same amount as the amount of the General Partner Note Payable. The General Partner Notes Payable mature based upon the terms of the limited partnership agreement of the respective fund. The carrying value of the General Partner Notes Payable represents the related GP Lender’s net asset value in the fund. The GP Lenders are entitled to all returned capital and profit distributions net of management fees and carried interest. We have elected the fair value option for the General Partner Notes Payable so that changes in value are recorded in investment income (loss). During 2021, the BDS I GP note payable was paid off.
|
|
|
|
|
Fair Value as of December 31, |
|
||||||
(in thousands) |
|
Commitment |
|
|
2021 |
|
|
2020 |
|
|||
Bridge Seniors Housing Fund I |
|
$ |
|
|
|
|
|
$ |
|
|||
Bridge Multifamily Fund III |
|
|
|
|
|
|
|
|
|
|||
Bridge Debt Strategies Fund I |
|
|
— |
|
|
|
— |
|
|
|
|
|
Total |
|
$ |
|
|
|
|
|
$ |
|
|||
The Company has no repayment obligation other than the return of capital and profit distributions, net of management fees and carried interest allocation of the respective fund.
14. LINE OF CREDIT
On July 22, 2020, the Company entered in a secured revolving line of credit to borrow up to $
15. NOTES PAYABLE
On July 22, 2020, Bridge entered into a $
The following table presents scheduled principal payments of the Company’s debt as of December 31, 2021:
(in thousands) |
|
|
|
|
2022 |
|
$ |
|
|
2023 |
|
|
|
|
2024 |
|
|
|
|
2025 |
|
|
|
|
2026 |
|
|
|
|
Thereafter |
|
|
|
|
Total |
|
$ |
|
|
101
The Company typically incurs and pays debt issuance costs when entering into a new debt obligation or when amending an existing debt agreement. Debt issuance costs related to the Company’s Private Notes are recorded as a reduction of the corresponding debt obligation. All debt issuance costs are amortized over the remaining term of the related obligation.
The following table presents the activity of the Company’s long-term debt issuance costs:
(in thousands) |
|
|
|
|
Unamortized debt issuance costs at December 31, 2019 |
|
$ |
|
|
Debt issuance costs incurred |
|
|
|
|
Amortization of debt issuance costs |
|
|
( |
) |
Debt extinguishment expense |
|
|
( |
) |
Unamortized debt issuance costs at December 31, 2020 |
|
|
|
|
Amortization of debt issuance costs |
|
|
( |
) |
Unamortized debt issuance costs at December 31, 2021 |
|
$ |
|
|
16. INVESTMENT INCOME (LOSS)
Investment income (loss) in the consolidated and combined statements of operations consist primarily of the realized and unrealized gains and losses on investments (including foreign exchange gains and losses attributable to foreign denominated investments and related activities) and other financial instruments, including the General Partner Note Payable for which the fair value option has been elected. Unrealized gains or losses result from changes in the fair value of these investments and other financial instruments during a period. Upon disposition of an investment or financial instrument, previously recognized unrealized gains or losses are reversed and an offsetting realized gain or loss is recognized in the current period.
The following tables summarize total investment income (loss) on investments and financial instruments for years ended December 31, 2021, 2020, and 2019.
|
|
Year Ended December 31, 2021 |
|
|||||||||
(in thousands) |
|
Net Realized |
|
|
Net Unrealized |
|
|
Total |
|
|||
Investment in Company-sponsored funds |
|
$ |
( |
) |
|
$ |
( |
) |
|
$ |
( |
) |
Investment in third-party partnerships |
|
|
( |
) |
|
|
|
|
|
|
||
Other investments |
|
|
|
|
|
|
|
|
|
|||
General Partner Notes Payable |
|
|
|
|
|
|
|
|
|
|||
Total investment (loss) income |
|
$ |
( |
) |
|
$ |
|
|
$ |
|
||
|
|
Year Ended December 31, 2020 |
|
|||||||||
(in thousands) |
|
Net Realized |
|
|
Net Unrealized |
|
|
Total |
|
|||
Investment in Company-sponsored funds |
|
$ |
( |
) |
|
$ |
|
|
$ |
|
||
Investment in third-party partnerships |
|
|
( |
) |
|
|
|
|
|
|
||
Other investments |
|
|
( |
) |
|
|
|
|
|
( |
) |
|
General Partner Notes Payable |
|
|
|
|
|
( |
) |
|
|
( |
) |
|
Total investment (loss) income |
|
$ |
( |
) |
|
$ |
|
|
$ |
|
||
|
|
Year Ended December 31, 2019 |
|
|||||||||
(in thousands) |
|
Net Realized |
|
|
Net Unrealized |
|
|
Total |
|
|||
Investment in Company-sponsored funds |
|
$ |
|
|
$ |
( |
) |
|
$ |
( |
) |
|
Investment in third-party partnerships |
|
|
( |
) |
|
|
( |
) |
|
|
( |
) |
Other investments |
|
|
|
|
|
( |
) |
|
|
|
||
General Partner Notes Payable |
|
|
|
|
|
( |
) |
|
|
( |
) |
|
Total investment income (loss) |
|
$ |
|
|
$ |
( |
) |
|
$ |
( |
) |
|
17.
We are taxed as a corporation for U.S. federal and state income tax purposes. We are subject to U.S. federal and state income taxes, in addition to local and foreign income taxes, with respect to our allocable share of any taxable income generated by the Operating Company that flows through to the Company.
102
Prior to our becoming a public company, other than BIGRM and BPM, the Company and its subsidiaries were limited liability companies or limited partnerships and, as such, were not subject to income taxes. The individual owners of Bridge were required to report their distributive share of the Company’s realized income, gains, losses, deductions, or credits on their individual income tax returns.
The components of income tax expense attributable to Bridge Investment Group Holdings Inc., including subsidiaries BIGRM and BPM, for the years ended December 31, 2021, 2020 and 2019 are as follows:
|
|
Year Ended December 31, |
|
|||||||||
(in thousands) |
|
2021 |
|
|
2020 |
|
|
2019 |
|
|||
Current income taxes: |
|
|
|
|
|
|
|
|
|
|||
Federal |
|
$ |
|
|
$ |
|
|
$ |
|
|||
State |
|
|
|
|
|
|
|
|
|
|||
Deferred income taxes: |
|
|
|
|
|
|
|
|
|
|||
Federal |
|
|
|
|
|
( |
) |
|
|
|
||
State |
|
|
( |
) |
|
|
|
|
|
|
||
Total income taxes |
|
$ |
|
|
$ |
|
|
$ |
|
|||
In connection with the exchanges of Operating Company interests for Class A common stock by the Original Equity Owners in July and August 2021, the Company’s ownership in the Operating Company increased, which resulted in an increase to deferred tax assets in the amount of $
The Company’s effective tax rate was
|
|
Year Ended December 31, |
||||
(in thousands) |
|
2021 |
|
2020 |
|
2019 |
Federal tax at statutory rate |
|
|
|
|||
State and local income tax (net of federal tax benefit) |
|
|
|
|||
Income passed to noncontrolling interests |
|
( |
|
( |
|
( |
Other |
|
|
|
|||
Effective tax rate |
|
|
|
|||
The Company evaluates the realizability of its deferred tax asset on a quarterly basis and adjusts the valuation allowance when it is more likely than not that all or a portion of the deferred tax asset may not be realized.
103
The net deferred income tax assets in the consolidated and combined balance sheets include the following amounts of deferred income tax assets and liabilities as of December 31, 2021, 2020, and 2019:
|
|
December 31, |
|
|||||||||
(in thousands) |
|
2021 |
|
|
2020 |
|
|
2019 |
|
|||
Deferred income tax assets: |
|
|
|
|
|
|
|
|
|
|||
Deferred TRA |
|
$ |
|
|
$ |
|
|
$ |
|
|||
Unrealized loss on securities |
|
|
|
|
|
|
|
|
|
|||
Loss reserve |
|
|
|
|
|
|
|
|
|
|||
Capital loss carryforward |
|
|
|
|
|
|
|
|
|
|||
Total deferred income tax assets |
|
|
|
|
|
|
|
|
|
|||
Less deferred income tax liabilities |
|
|
|
|
|
|
|
|
|
|||
Unrealized gain on securities |
|
|
( |
) |
|
|
( |
) |
|
|
( |
) |
Total deferred income tax liabilities |
|
|
( |
) |
|
|
( |
) |
|
|
( |
) |
Net deferred income tax assets |
|
$ |
|
|
$ |
|
|
$ |
|
|||
As of both December 31, 2021 and 2020, the Company had
The Company files its tax returns as prescribed by the tax laws of the jurisdictions in which it operates. In the normal course of business, the Company is subject to examination by U.S. federal, state, local and foreign tax authorities. Although the outcome of tax audits is always uncertain, the Company does not believe the outcome of any future audit will have a material adverse effect on the Company’s consolidated and combined financial statements.
18. SHAREHOLDERS’ EQUITY
Bridge Investment Group Holdings Inc.
The Company has two classes of common stock outstanding, Class A common stock and Class B common stock. Class A common stock is traded on the New York Stock Exchange. The Company is authorized to issue
The following table presents a reconciliation of Bridge Investment Group Holdings Inc. common stock for the year ended December 31, 2021:
|
Bridge Investment Group Holdings Inc. |
|
|||||||||
|
|
|
|
Class A |
|
|
|
|
|||
|
Class A |
|
|
restricted |
|
|
Class B |
|
|||
|
common |
|
|
common |
|
|
common |
|
|||
|
stock |
|
|
stock |
|
|
stock |
|
|||
Balance as of December 31, 2020 |
|
|
|
|
|
|
|
|
|||
Effect of Transactions and IPO |
|
|
|
|
|
|
|
|
|||
Class A common stock issued - sold in IPO |
|
|
|
|
— |
|
|
|
( |
) |
|
Restricted Stock issued |
|
— |
|
|
|
|
|
|
— |
|
|
Restricted Stock forfeited |
|
— |
|
|
|
( |
) |
|
|
( |
) |
Balance as of December 31, 2021 |
|
|
|
|
|
|
|
|
|||
Dividends are reflected when paid in the consolidated and combined statements of stockholders’ equity, while distributions are reflected when declared by the Company’s board of directors. Dividends are made to Class A common stockholders and distributions are made to members of the Operating Company and holders of non-controlling interests in subsidiaries.
104
During the quarter ended December 31, 2021, the Company declared and paid a quarterly dividend of $
Bridge Investment Group Holdings LLC
Prior to the IPO, the Operating Company had three classes of membership interests: (i) Class A; (ii) Class B-1; and (iii) Class B-2. Class A and Class B-1 represented the voting equity holders and Class B-2 represented profits interests awarded to employees of the Operating Company. Class B-1 and B-2 interests were issued as “profits interests,” pursuant to agreements entered into with certain employees during 2021, 2020 and 2019. At the time of issuance, the Class B-1 and B-2 interests had a capital account interest of zero percent. The holders of Class B-1 and B-2 interests were entitled to distributions in excess of the defined threshold per the respective award. The holders of Class B-2 interests did not have voting rights. As part of the Transactions, the Class B-1 and Class B-2 Units were exchanged for Class A Units in the Operating Company. As part of the Transactions and IPO,
Net profits and any other items of income are allocated to the members’ capital accounts in a manner that is consistent with their respective ownership percentages. Distributions to members are generally made in a manner consistent with their respective ownership percentages at the time the profits were generated and are subject to approval of the Company’s board of directors. During the years ended December 31, 2021 and 2020, $
The Operating Company’s members’ capital interests are transferable; however, transfers are subject to obtaining the prior written consent of the Company, with certain exceptions for transfers to affiliated parties. Members’ liability is limited to the capital account balance. Distributions are reflected in the consolidated and combined statements of changes in shareholders’ and members’ equity when declared by the board of directors and consist of distributions to members and non-controlling interest holders.
As of December 31, 2021, the Company is the sole managing member of the Operating Company and owns
The following table presents a reconciliation of Bridge Investment Group Holdings LLC Interests for the year ended December 31, 2021:
|
Bridge Investment Group Holdings LLC |
|
|||||||||
|
|
|
|
|
|
|
Class B-1/2 |
|
|||
|
Class A |
|
|
Class B |
|
|
common |
|
|||
|
Units |
|
|
Units |
|
|
units |
|
|||
Balance as of December 31, 2020 |
|
|
|
|
|
|
|
|
|||
Equity reallocation prior to Transactions |
|
|
|
|
|
|
|
( |
) |
||
Effect of Transactions and purchase of |
|
|
|
|
— |
|
|
|
— |
|
|
Purchase of partnership interests with |
|
|
|
|
— |
|
|
|
— |
|
|
Balance as of December 31, 2021 |
|
|
|
|
|
|
|
|
|||
Initial Public Offering
On the closing of the IPO, owners of the Contributed Bridge GPs contributed their interests in the respective Contributed Bridge GPs in exchange for LLC Interests in the Operating Company. Prior to the IPO, the Operating Company did not have any direct interest in the Contributed Bridge GPs. These consolidated and combined financial statements include 100% of operations of the Contributed Bridge GPs for the periods presented on the basis of common control prior to the Transactions. Subsequent to the Transactions, the Operating Company consolidated the Contributed Bridge GPs. The net income that is not attributable to the Operating Company is reflected in net income attributable to non-controlling interests in the subsidiaries in the consolidated and combined statements of operations and comprehensive income.
105
Prior to the Transactions, the Contributed Bridge GPs had three classes of shares: (i) Class A; (ii) Class C; and (iii) Class D. Class A represents the voting interest and Classes C and D represent allocations of carried interest to employees of the Operating Company, which are included in performance allocations compensation. As part of the Transactions, all of the Class C shares of the Contributed Bridge GPs were exchanged for interests in the Operating Company. Generally, if at the termination of a fund, the fund has not achieved investment returns that exceed the preferred return threshold or the funds have received net profits over the life of the fund in excess of its allocable share under the applicable partnership agreement, the Bridge GPs will be obligated to repay an amount equal to the excess of amounts previously distributed to the general partner over the amounts to which the general partner was ultimately entitled (generally net of income tax liabilities associated with related allocations of taxable income).
All of the distributable earnings of the Operating Company prior to the IPO were payable to the Original Equity Owners. As of December 31, 2021, there was $
19. COMMITMENTS AND CONTINGENCIES
Long-Term Leases — The Company leases office space generally under long-term non-cancelable operating lease agreements. The terms of each lease are unique and some permit early cancellation, while other leases have only a short period of time remaining on what was originally a longer dated lease agreement that is nearing the maturity.
The table below provides the future minimum rental payments required as of December 31, 2021, in the aggregate and for each of the five succeeding fiscal years for leases greater than a year in length, taking into consideration cancellation options during the life of the lease.
|
|
Year Ended |
|
|
(in thousands) |
|
December 31, |
|
|
2022 |
|
$ |
|
|
2023 |
|
|
|
|
2024 |
|
|
|
|
2025 |
|
|
|
|
2026 |
|
|
|
|
Thereafter |
|
|
|
|
Total |
|
$ |
|
|
Certain leases contain renewal options, rent escalations based on increases in certain costs incurred by the lessor or increases in the fair market value of the leased property, and terms to pay a proportionate share of the operating expenses. Rent expense is recorded on a straight-line basis over the lease term for leases with determinable rent escalation and lease incentives. These items resulted in long term deferred rent of $
The Company has other operating leases related to computers, copiers and other office equipment that were determined to be immaterial and are not included in the table above.
106
Allocated Performance Income — Allocated performance income is affected by changes in the fair values of the underlying investments in the funds that we advise. Valuations, on an unrealized basis, can be significantly affected by a variety of external factors including, but not limited to, public equity market volatility, industry trading multiples and interest rates. Generally, if at the termination of a fund (and at interim points in the life of a fund), the fund has not achieved investment returns that (in most cases) exceed the preferred return threshold or (in all cases) the applicable Bridge GP receives net profits over the life of the fund in excess of its allocable share under the applicable partnership agreement, the Bridge GP will be obligated to repay carried interest that was received by the Bridge GP in excess of the amounts to which the Bridge GP is entitled. This contingent obligation is normally reduced by income taxes paid by the members of the Bridge GP (including the Company) related to its carried interest. Additionally, at the end of the life of the funds there could be a payment due to a fund by the Bridge GP if the Bridge GP has recognized more performance income than was ultimately earned. The general partner clawback obligation amount, if any, will depend on final realized values of investments at the end of the life of the fund.
At December 31, 2021 and 2020, if the Company assumed all existing investments were worthless, the amount of performance income subject to potential repayment by the Bridge GPs, net of tax distributions, which may differ from the recognition of revenue, would have been approximately $
Legal Matters — In the normal course of business, the Company is party to certain claims or legal actions. Although the amount of the ultimate exposure cannot be determined at this time, the Company believes that the resolution of these matters will not have a material adverse effect on its financial position, liquidity or results of operations.
Standby Letters of Credit — As of December 31, 2021, the Company has guaranteed a $
Indemnification Arrangements — In the normal course of business and consistent with standard business practices, the Company has provided general indemnifications to certain officers and directors when they act in good faith in the performance of their duties for the Company. The Company’s maximum exposure under these arrangements cannot be determined as these indemnities relate to future claims that may be made against the Company or related parties, but which have not yet occurred. No liability related to these indemnities has been recorded in the consolidated balance sheet as of December 31, 2021. Based on past experience, management believes that the risk of loss related to these indemnities is remote.
20. VARIABLE INTEREST ENTITIES
A VIE is an entity that lacks sufficient equity to finance its activities without additional subordinated financial support from other parties, or whose equity holders lack the characteristics of a controlling financial interest. The Company-sponsors private funds and other investment vehicles as general partner for the purpose of providing investment management services in exchange for management fees and performance-based fees. These private funds are established as limited partnerships or equivalent structures. Limited partners of the private funds do not have either substantive liquidation rights, or substantive kick-out rights without cause, or substantive participating rights that could be exercised by a simple majority of limited partners or by a single limited partner. Accordingly, the absence of such rights, which represent voting rights in a limited partnership, results in the private funds being considered VIEs. The nature of the Company’s involvement with its sponsored funds comprises fee arrangements and equity interests. The fee arrangements are commensurate with the level of management services provided by the Company and contain terms and conditions that are customary to similar at-market fee arrangements.
The Company does not consolidate its sponsored private funds where it has insignificant direct equity interests or capital commitments to these funds as general partner. As the Company’s direct equity interests in its sponsored private funds as general partner absorb insignificant variability, the Company is considered to be acting in the capacity of an agent of these funds and is therefore not the primary beneficiary of these funds. The Company accounts for its equity interests in unconsolidated sponsored private funds under the equity method. Additionally, the Company has investments in funds sponsored by third parties that we do not consolidate as we are not the primary beneficiary. The Company’s maximum exposure to loss is limited to the carrying value of its investment in the unconsolidated private funds, totaling $
107
The Company consolidates certain VIEs for which it is the primary beneficiary. Pre-IPO VIEs consist of certain operating entities not wholly owned by the Company and include Bridge Seniors Housing Fund Manager LLC, Bridge Debt Strategies Fund Manager LLC, Bridge Office Fund Manager LLC, Bridge Agency MBS Fund Manager LLC, Bridge Net Lease Fund Manager LLC, Bridge Logistics Properties Fund Manager LLC, and the Bridge GPs. As part of the Transactions and IPO, the Operating Company acquired the non-controlling interest of its consolidated subsidiaries BSHM and BOFM which was accounted for as an equity transaction with no gain or loss recognized in combined net income. The carrying amounts of the non-controlling interest in BSHM and BOFM were adjusted to zero. The assets of the consolidated VIEs totaled $
21. RELATED-PARTY TRANSACTIONS
Substantially all of the Company’s revenue is earned from its affiliates, including fund management fees, property management and leasing fees, construction management fees, development fees, transaction fees, insurance premiums, and real estate mortgage brokerage and administrative expense reimbursements. The related accounts receivable is included within Receivables from Affiliates within the consolidated and combined balance sheets.
The Company has investment management agreements with the funds that it manages. In accordance with these agreements, the funds may bear certain operating costs and expenses which are initially paid by the Company and subsequently reimbursed by the funds.
The Company also has entered into agreements to be reimbursed for its expenses incurred for providing administrative services to certain related parties, including Bridge Founders Group, LLC, and affiliates of the Company also provide property management services for certain properties owned by Bridge Founders Group, LLC, on terms substantially similar to those available to third parties for similar services. Employees and other related parties may be permitted to invest in Bridge funds alongside fund investors. Participation is limited to individuals who qualify under applicable securities laws. These funds generally do not require these individuals to pay management or performance fees.
|
|
December 31, |
|
|||||
(in thousands) |
|
2021 |
|
|
2020 |
|
||
Fees receivable from non-consolidated funds |
|
$ |
|
|
$ |
|
||
Payments made on behalf of and amounts due from non-consolidated entities |
|
|
|
|
|
|
||
Total receivables from affiliates |
|
$ |
|
|
$ |
|
||
|
|
|
|
|
|
|
||
As of December 31, 2021, the Company had accrued a $
22. SHARE-BASED COMPENSATION AND PROFITS INTERESTS
Restricted Stock and RSUs
On July 6, 2021, the Company adopted the 2021 Incentive Award Plan, which became effective on July 20, 2021, under which
The fair value of the Restricted Stock and RSUs is based upon our stock price at grant date and is expensed over the vesting period. We classify both Restricted Stock and RSUs as equity instruments. Share-based compensation expense is included in employee compensation and benefits in the consolidated and combined statement of operations, with the corresponding increase included in additional paid-in capital or non-controlling interests in consolidated and combined balance sheet. If the recipient leaves prior to vesting of the Restricted Stock or RSUs, the awards are forfeited. During the year ended December 31, 2021, the Company reversed $
108
Restricted Stock is Class A common stock with certain restrictions that relate to trading and carry the possibility of forfeiture. Holders of Restricted Stock have full voting rights and receive dividend equivalents during the vesting period. RSUs represent rights to one share of common stock for each unit. Holders of RSUs receive dividends during the vesting period but do not have voting rights.
During the year ended December 31, 2021,
|
|
|
Weighted- |
|
||
|
|
|
average fair |
|
||
|
Restricted |
|
value per |
|
||
|
Stock |
|
share |
|
||
Balance as of December 31, 2020 |
|
|
|
|
||
Effect of transactions and IPO |
|
|
$ |
|
||
Issued |
|
|
|
|
||
Forfeited |
|
( |
) |
|
|
|
Balance as of December 31, 2021 |
|
|
$ |
|
||
The total value at grant date of Restricted Stock and RSUs granted during the year ended December 31, 2021 was $
At December 31, 2021, the aggregate unrecognized compensation cost for all unvested Restricted Stock and RSU awards was $
Profits Interests
The Operating Company issued profits interests in the Operating Company and certain Fund Managers in 2019, 2020, and 2021 to certain members of management to participate in the growth of the Operating Company and the respective Fund Managers. A holding company was formed for each of the Fund Managers to hold these profits interests. The holding company’s ownership equates from
If the recipient leaves after the awards vest, the Company has the option to repurchase the shares at fair value. If the recipient leaves prior to vesting, the awards are forfeited.
At December 31, 2021, the aggregate unrecognized compensation cost for all unvested profits interests awards was $
The following table summarizes our share-based compensation expense associated with our profits interests awards, Restricted Stock, and RSUs, which is recorded in employee compensation and benefits on the consolidated and combined statement of operations and comprehensive income:
|
|
Year Ended December 31, |
|
|||||||||
(in thousands) |
|
2021 |
|
|
2020 |
|
|
2019 |
|
|||
Antidilutive profits interests awards |
|
$ |
|
|
$ |
|
|
$ |
|
|||
Profits interests award shares |
|
|
|
|
|
|
|
|
|
|||
Restricted Stock and RSUs |
|
|
|
|
|
|
|
|
|
|||
Total share-based compensation |
|
$ |
|
|
$ |
|
|
$ |
|
|||
109
As of December 31, 2021, unrecognized share-based compensation on Restricted Stock, RSUs and profits interests awards is expected to be recognized as follows:
|
|
Year Ended December 31, |
|
|||||||||
|
|
|
|
|
|
|
|
Profits |
|
|||
|
|
|
|
|
Restricted Stock |
|
|
interests |
|
|||
(in thousands) |
|
Total |
|
|
and RSUs |
|
|
awards |
|
|||
2022 |
|
$ |
|
|
$ |
|
|
$ |
|
|||
2023 |
|
|
|
|
|
|
|
|
|
|||
2024 |
|
|
|
|
|
|
|
|
|
|||
2025 |
|
|
|
|
|
|
|
|
|
|||
2026 |
|
|
|
|
|
|
|
|
|
|||
Total |
|
$ |
|
|
$ |
|
|
$ |
|
|||
23. EARNINGS PER SHARE
We compute earnings per share (“EPS”) only for the period our Class A common stock was outstanding during 2021, specifically the post-IPO period. Basic and diluted net earnings per share of Class A common stock is presented for the period from July 16, 2021 through December 31, 2021, the period following the Transactions and IPO. There were no shares of Class A common stock outstanding prior to the Transactions and the IPO, therefore, no net earnings per share information has been presented for any period prior to the date of the IPO.
(in thousands, except share and per share amounts) |
|
|
|
|
Numerator: |
|
|
|
|
Income attributable to Bridge Investment Group |
|
$ |
|
|
Less: |
|
|
|
|
Income allocated to Restricted Stock and RSUs |
|
|
( |
) |
Distributions on Restricted Stock and RSUs |
|
|
( |
) |
Earnings available to Class A common shareholders - basic and diluted |
|
$ |
|
|
|
|
|
|
|
Denominator: |
|
|
|
|
Weighted-average shares of Class A common stock outstanding - basic and diluted |
|
|
|
|
Earnings per share of Class A common stock - basic and diluted |
|
$ |
|
|
Basic earnings per share is calculated by dividing earnings available to Class A common shareholders by the weighted-average number of Class A common shares outstanding for the period. Restricted Stock and RSUs that contain non-forfeitable rights to dividends are participating securities and are included in the computation of earnings per share pursuant to the two-class method. Accordingly, distributed and undistributed earnings attributable to unvested Restricted Stock have been excluded as applicable, from earnings available to Class A common stockholders used in basic and diluted earnings per share.
Diluted earnings per share of Class A common stock is computed by dividing earnings available to Bridge Investment Group Holdings Inc., giving consideration to the reallocation of net income between holders of Class A common stock and non-controlling interests, by the weighted-average number of shares of Class A common stock outstanding adjusted to give effect to potentially dilutive securities, if any.
Shares of the Company’s Class B common stock do not share in the earnings or losses attributable to the Company and therefore are not participating securities. As a result, a separate presentation of basic and diluted earnings per share of Class B common stock under the two-class method has not been included.
110
24. EMPLOYEE BENEFIT PLAN
The Company participates in a defined contribution plan covering all eligible employees whereby employees may elect to contribute a percentage of their compensation to the plan. Employees that are age
25. SUBSEQUENT EVENTS
Redemption of Equity Interests
On January 1, 2022, the Company’s 2019 profits interests awards were collapsed into
Standby Letter of Credit
In January 2022, the Company increased its guarantee from $
Business Acquisition
In December 2021, the Company, through its Operating Company and subsidiaries, entered into definitive agreements to acquire certain assets of Gorelick Brothers Capital (“GBC”), including a 60% interest in GBC’s asset and property management business. The
In connection with the transaction, the Company expensed approximately $
Dividends to Class A common stockholders
In March 2022, the Company’s board of directors declared a quarterly dividend of $
Notes Receivable from Affiliates
111
Subsequent to December 31, 2021, the Company received payments for the following amounts:
(in thousands) |
|
|
|
|
Entity |
|
|
|
|
Bridge Multifamily V |
|
$ |
|
|
Bridge Logistics U.S. Venture I |
|
|
|
|
Bridge Senior Housing Fund III |
|
|
|
|
Total |
|
$ |
|
|
Item 9. Changes in and Disagreements With Accountants on Accounting and Financial Disclosure
None.
Item 9A. Controls and Procedures.
Conclusion Regarding the Effectiveness of Disclosure Controls and Procedures
We maintain disclosure controls and procedures, as such term is defined in Rules 13a-15(e) and 15d-15(e) under the Exchange Act, that are designed to ensure that information required to be disclosed in our reports that we file under the Exchange Act is recorded, processed, summarized and reported within the time periods specified in the SEC’s rules and forms, and that such information is accumulated and communicated to our management, including our Chief Executive Officer and Chief Financial Officer, as appropriate, to allow timely decisions regarding required disclosure. In designing and evaluating the disclosure controls and procedures, management recognizes that any controls and procedures, no matter how well designed and operated, can provide only reasonable and not absolute assurance of achieving the desired control objectives. In reaching a reasonable level of assurance, management necessarily was required to apply its judgment in evaluating the cost-benefit relationship of possible controls and procedures. In addition, the design of any system of controls also is based in part upon certain assumptions about the likelihood of future events, and there can be no assurance that any design will succeed in achieving its stated goals under all potential future conditions.
Our management, with the participation of our Chief Executive Officer and Chief Financial Officer, has evaluated, as of the end of the period covered by this annual report on Form 10-K, the effectiveness of our disclosure controls and procedures. Based on such evaluation, our Chief Executive Officer and Chief Financial Officer have concluded that as of December 31, 2021, our disclosure controls and procedures were effective.
Management’s Report on Internal Control over Financial Reporting
This report does not include a report on management’s assessment regarding internal control over financial reporting or an attestation report of our registered public accounting firm due to a transition period established by the SEC for newly public companies.
Because we are an “emerging growth company” under the JOBS Act, our independent public accounting firm will not be required to attest to the effectiveness of our internal control over financial reporting for so long as we are an emerging growth company.
Changes in Internal Control Over Financial Reporting
There have been no changes in our internal control over financial reporting during the three months ended December 31, 2021 that have materially affected, or are reasonably likely to materially affect, our internal control over financial reporting.
Item 9B. Other Information
None.
Item 9C. Disclosure Regarding Foreign Jurisdictions that Prevent Inspections
Not applicable.
112
PART III
Item 10. Directors, Executive Officers and Corporate Governance
The information required by this item is incorporated by reference to our definitive Proxy Statement for the 2022 Annual Meeting of Stockholders to be filed with the Securities and Exchange Commission within 120 days of December 31, 2021.
Item 11. Executive Compensation
The information required by this item is incorporated by reference to our definitive Proxy Statement for the 2022 Annual Meeting of Stockholders to be filed with the Securities and Exchange Commission within 120 days of December 31, 2021.
Item 12. Security Ownership of Certain Beneficial Owners and Management and Related Stockholder Matters
The table below provides information concerning the awards that may be issued under our 2021 incentive award plan as of December 31, 2021.
|
|
|
|
|
Number of securities |
|
|||
|
|
|
|
|
remaining available |
|
|||
|
(a) |
|
|
|
for future issuance |
|
|||
|
Number of securities |
|
(b) |
|
under equity |
|
|||
|
to be issued upon |
|
Weighted-average |
|
compensation plans |
|
|||
|
exercise of outstanding |
|
exercise price of |
|
(excluding securities |
|
|||
|
options, warrants |
|
outstanding options, |
|
reflected in column (a)) (2) |
|
|||
Plan Category |
and rights (1) |
|
warrants and rights |
|
(in thousands) |
|
|||
Equity compensation plans approved by security holders |
|
16,500 |
|
NA |
|
|
4,450,628 |
|
|
Equity compensation plans not approved by security holders |
|
— |
|
|
— |
|
|
— |
|
Total |
|
16,500 |
|
NA |
|
|
4,450,628 |
|
|
(1) Includes shares subject to outstanding RSUs granted under our 2021 Incentive Award Plan as of December 31, 2021. Pursuant to SEC rules, excludes 2,132,872 Restricted Stock issued under our 2021 Incentive Award Plan as of December 31, 2021.
(2) Includes shares available for future issuance under our 2021 Incentive Award Plan.
Other information required by this item is incorporated by reference to our definitive Proxy Statement for the 2022 Annual Meeting of Stockholders to be filed with the Securities and Exchange Commission within 120 days of December 31, 2021.
Item 13. Certain Relationships and Related Transactions, and Director Independence
The information required by this item is incorporated by reference to our definitive Proxy Statement for the 2022 Annual Meeting of Stockholders to be filed with the Securities and Exchange Commission within 120 days of December 31, 2021.
Item 14. Principal Accountant Fees and Services
The information required by this item is incorporated by reference to our definitive Proxy Statement for the 2022 Annual Meeting of Stockholders to be filed with the Securities and Exchange Commission within 120 days of December 31, 2021.
PART IV
Item 15. Exhibit and Financial Statement Schedules
The following documents are filed as part of this annual report on Form 10-K:
(1) Financial Statements
113
Index to Consolidated and Combined Financial Statements |
Page |
75 |
|
Consolidated and Combined Balance Sheets as of December 31, 2021 and 2020 |
76 |
77 |
|
78 |
|
79 |
|
80 |
|
81 |
(2) Financial Statement Schedules
All financial statement schedules for which provision is made in the applicable accounting regulations of the SEC are not required under the related instructions, the required information is contained elsewhere in this annual report on Form 10-K, or the schedules are inapplicable and have therefore been omitted.
(3) Exhibits
The following is a list of all exhibits filed or furnished as part of this report.
114
Exhibit Index
|
|
Incorporated by Reference |
|
||
Exhibit Number |
Exhibit Description |
Form |
Filing Date |
Exhibit Number |
Filed Herewith |
3.1 |
Amended and Restated Certificate of Incorporation of Bridge Investment Group Holdings Inc. |
10-Q |
8/17/21 |
3.1 |
|
3.2 |
Amended and Restated Bylaws of Bridge Investment Group Holdings Inc. |
10-Q |
8/17/21 |
3.2 |
|
4.1 |
Specimen stock certificate evidencing the shares of Class A common stock |
S-1/A |
7/2/2021 |
4.1 |
|
4.2 |
Description of Securities Registered under Section 12 of the Exchange Act |
|
|
|
X |
10.1 |
8-K |
7/20/2021 |
10.1 |
|
|
10.2 |
8-K |
7/20/2021 |
10.4 |
|
|
10.3 |
8-K |
7/20/2021 |
10.3 |
|
|
10.4 |
8-K |
7/20/2021 |
10.2 |
|
|
10.5# |
2021 Incentive Award Plan of Bridge Investment Group Holdings Inc. |
S-1/A |
7/2/2021 |
10.5 |
|
10.6# |
Non-Employee Director Compensation Program of Bridge Investment Group Holdings Inc. |
S-1/A |
7/2/2021 |
10.6 |
|
10.7# |
S-1/A |
7/2/2021 |
10.7 |
|
|
10.8# |
10-Q |
8/17/21 |
10.8 |
|
|
10.9# |
10-Q |
8/17/21 |
10.9 |
|
|
10.10# |
10-Q |
8/17/21 |
10.10 |
|
|
10.11# |
10-Q |
8/17/21 |
10.11 |
|
|
10.12 |
S-1/A |
7/2/2021 |
10.12 |
|
|
10.13 |
S-1/A |
7/2/2021 |
10.13 |
|
|
21.1 |
|
|
|
X |
|
23.1 |
|
|
|
X |
|
31.1 |
|
|
|
X |
|
31.2 |
|
|
|
X |
|
32.1* |
Certification of Chief Executive Officer pursuant to Section 906 of the Sarbanes-Oxley Act of 2002. |
|
|
|
X |
32.2* |
Certification of Chief Financial Officer pursuant to Section 906 of the Sarbanes-Oxley Act of 2002. |
|
|
|
X |
101.SCH |
Inline XBRL Instance Document (the instance document does not appear in the Interactive Data File because its XBRL tags are embedded within the Inline XBRL document) |
|
|
|
X |
101.CAL |
Inline XBRL Taxonomy Extension Schema Document |
|
|
|
X |
101.DEF |
Inline XBRL Taxonomy Extension Definition Linkbase Document |
|
|
|
X |
101.LAB |
Inline XBRL Taxonomy Extension Label Linkbase Document |
|
|
|
X |
101.PRE |
Inline XBRL Taxonomy Extension Presentation Linkbase Document |
|
|
|
X |
104 |
Cover Page Interactive Data File (formatted as inline XBRL and contained in Exhibit 101) |
|
|
|
X |
# Indicates management contract or compensatory plan.
* This certification is deemed not filed for purpose of section 18 of the Exchange Act or otherwise subject to the liability of that section, nor shall it be deemed incorporated by reference into any filing under the Securities Act or the Exchange Act.
Item 16. Form 10-K Summary
None.
115
SIGNATURES
Pursuant to the requirements of Section 13 or 15(d) of the Securities Exchange Act of 1934, the Registrant has duly caused this report to be signed on its behalf by the undersigned, thereunto duly authorized.
|
|
|
|
|
|
BRIDGE INVESTMENT GROUP HOLDINGS INC. |
|
|
|
|
|
Date: March 18, 2022 |
|
By: |
/s/ Jonathan Slager
|
|
|
|
Jonathan Slager |
|
|
|
Chief Executive Officer |
|
|
|
(Principal Executive Officer) |
Pursuant to the requirements of the Securities Exchange Act of 1934, this report has been signed below by the following persons on behalf of the Registrant and in the capacities indicated on March 18, 2022.
|
|
|
/s/ Jonathan Slager
|
|
/s/ Chad Briggs
|
Jonathan Slager |
|
Chad Briggs |
Chief Executive Officer, Director |
|
Chief Financial Officer |
(Principal Executive Officer) |
|
(Principal Financial Officer) |
|
|
|
/s/ Katherine Elsnab
|
|
/s/ Robert Morse
|
Katherine Elsnab |
|
Robert Morse |
Chief Accounting Officer, Controller |
|
Executive Chairman, Director |
(Principal Accounting Officer) |
|
|
|
|
|
/s/ Dean Allara
|
|
/s/ Adam O’Farrell
|
Dean Allara |
|
Adam O’Farrell |
Vice Chairman and Head of Client Solutions Group, Director |
|
Chief Operating Officer, Director |
|
|
|
/s/ Debra Martin Chase
|
|
/s/ Deborah Hopkins
|
Debra Martin Chase |
|
Deborah Hopkins |
Director |
|
Director |
|
|
|
/s/ Chad Leat
|
|
|
Chad Leat |
|
|
Director |
|
|
|
|
|
116